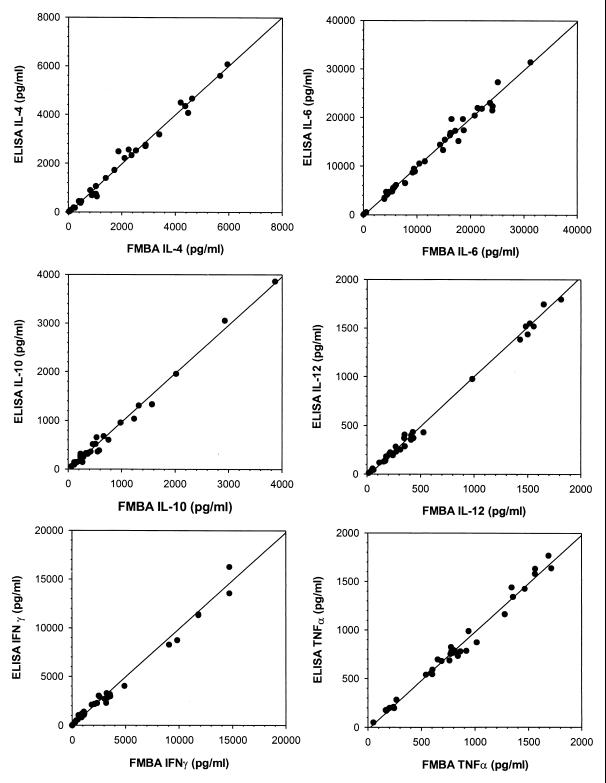
FIG. 4.
Correlation between FMBA and Immunotech ELISA for IL-4, IL-6, IL-10, IL-12, IFN-γ, and TNF-α on 40 samples. Linear regressions were calculated as follows: for IL-4, y = 0.96x − 10.07 and r = 0.982; for IL-6, y = 0.96x − 4.33 and r = 0.987; for IL-10, y = 0.1.16x − 4.15 and r = 0.989; for IL-12, y = 0.92x − 11.43 and r = 0.994; for IFN-γ, y = 1.17x − 8.33 and r = 0.989; for TNF-α, y = 0.93x + 3.38 and r = 0.986.

