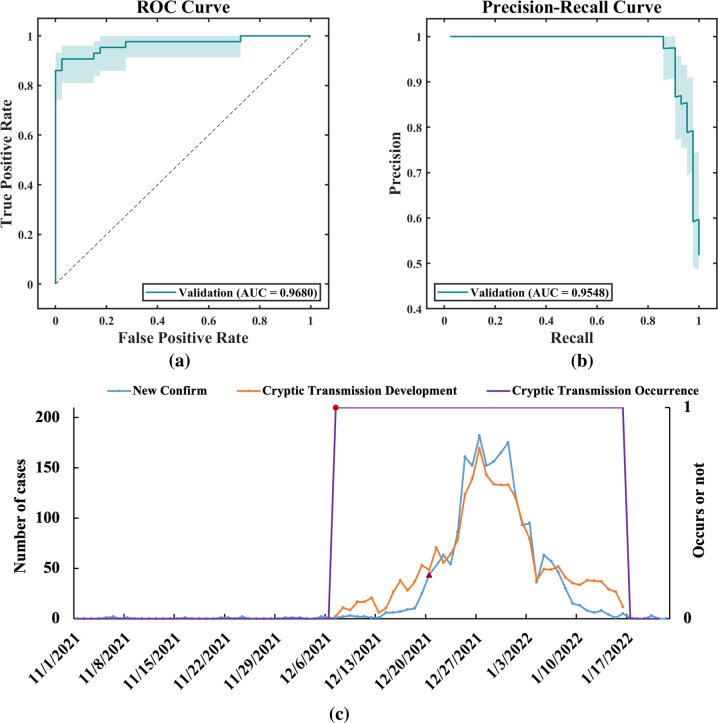
Fig. 7. Occurrence, development, and fitting of the external validation data.
a The ROC curves of early warning; b the PR curves of early warning; c the fitting curve of the occurrence and development of the epidemic. The blue line represents the actual number of confirmed cases per day, the purple line represents the predicted occurrence result of the model, the orange line represents the predicted development result of the model, the triangular icon represents the time point of the official report of cryptic transmission, the circular icon represents the time point of our prediction of the occurrence of cryptic transmission, and our prediction time is 13 days ahead of the official date.

