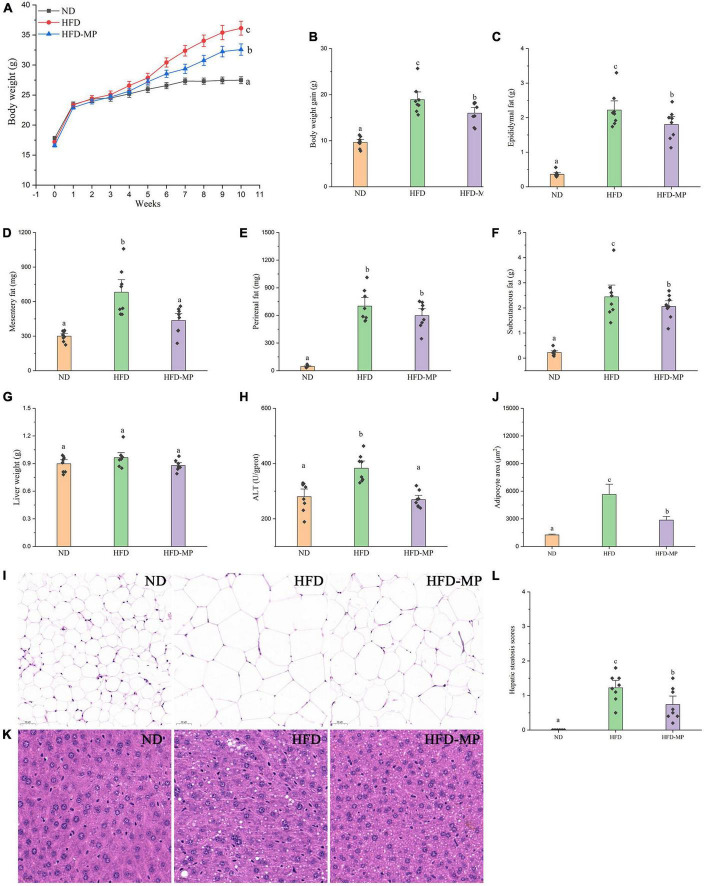
FIGURE 1.
Impact of HFD and MP intervention on body features of mice. (A) Body weight, (B) body weight gain, weights of (C) epididymal, (D) mesentery, (E) perirenal, (F) subcutaneous fat pads, (G) liver weight, (H) plasma alanine transaminase (ALT) level, epididymal adipocyte sections after H&E staining (I), quantification of adipocyte area by ImageJ software (J), liver (K) sections after H&E staining, and hepatic steatosis scores (L). The data are represented as the mean ± SEM. Statistical differences were carried out by one-way ANOVA followed by Turkey’s test, p < 0.05 indicates significant differences.

