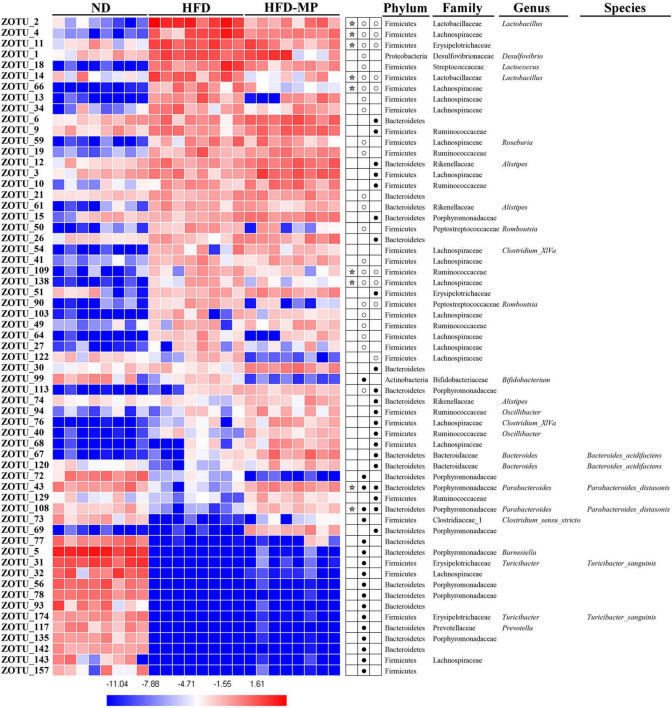
FIGURE 7.
Gut microbiota composition was altered by HFD or MP intervention at the ZOTUs levels. Heatmap shows the relative abundance of 62 ZOTUs (ln transformed). The dots (●) and circles (○) showed the more or less relative abundances of ZOTUs in ND or MPs groups compared with the HFD group. The star (☆) represented ZOTUs changed by HFD but were reversed after treatment with MPs. Statistical differences were carried out by one-way ANOVA followed by Tukey’s test, p < 0.05 indicates significant differences.

