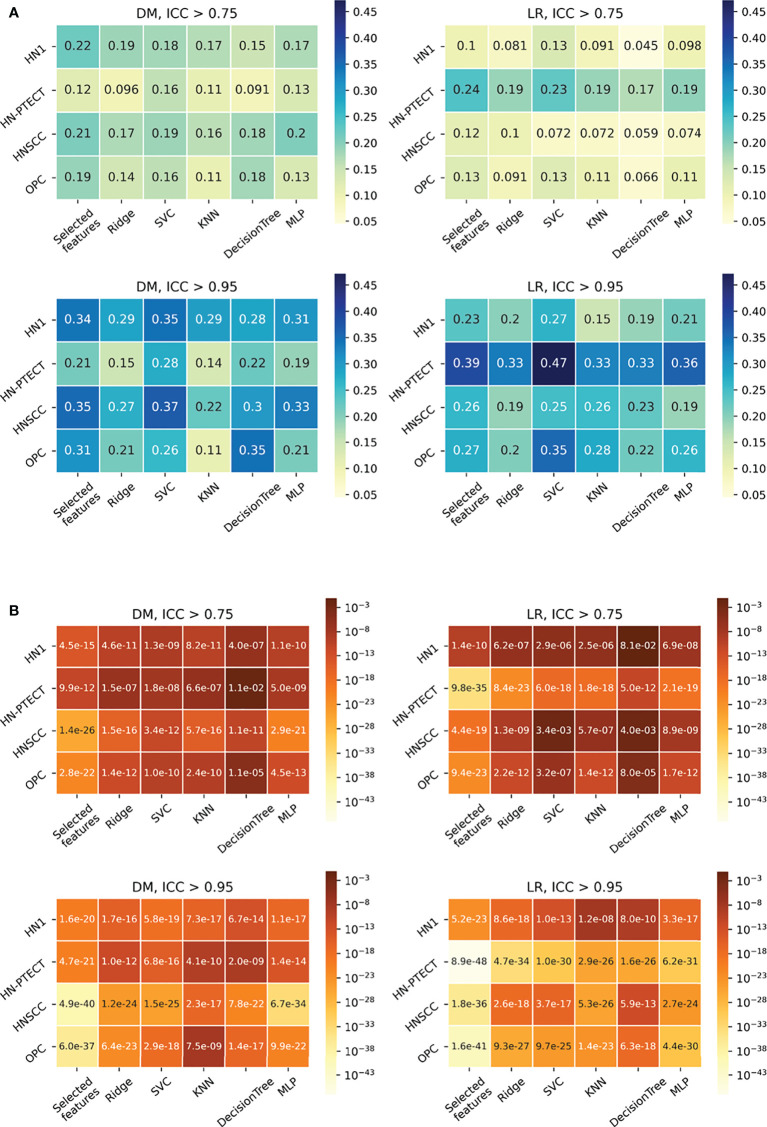
Figure 4.
Average intraclass correlation coefficient (ICC) improvement (A) and t-test P-values (B) of the final selected features and testing predictions after robust feature pre-selection shown in heatmaps. Each heatmap contains the results of one prediction outcome and one feature robustness filtering threshold. The first column of each heatmap represents the improvements of the final selected radiomic features, and the remaining five columns are the improvements of the testing prediction robustness using different classifiers. Results of the four datasets are recorded in rows. All the experiments showed positive improvements in ICC. A higher and more statistically significant increase in average ICC improvements can be observed with a higher filtering threshold.

