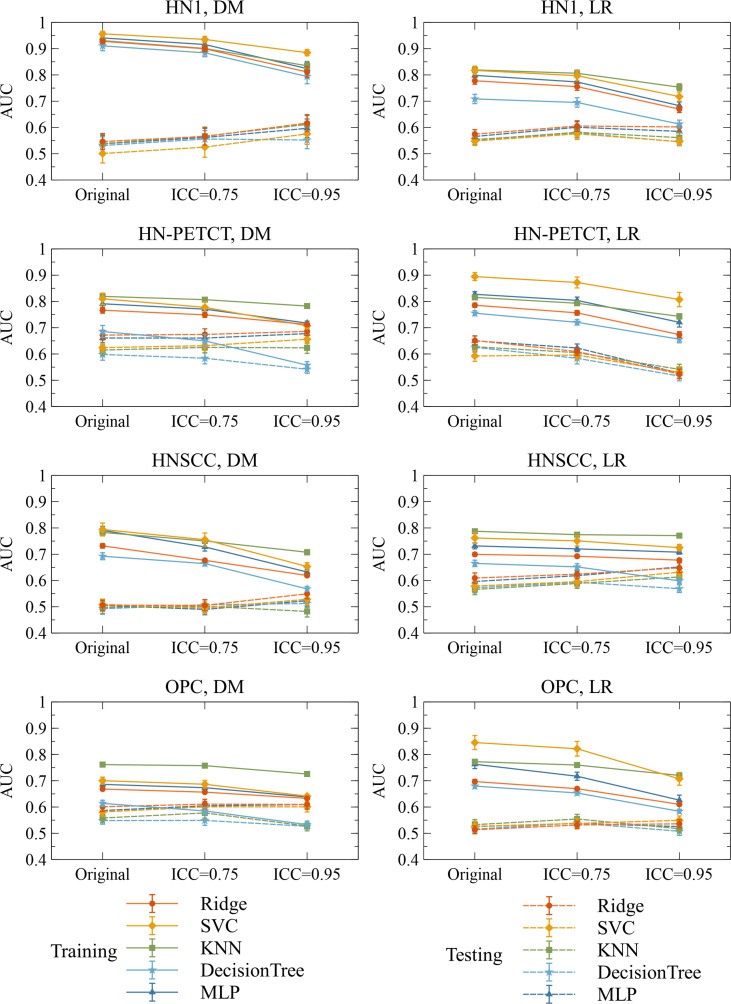
Figure 7.
The mean and its 95% confidence interval of the training and testing AUCs of the final constructed models. Each color represents one classifier for modeling. The solid lines represent the training performances, and the dashed lines represent the testing performances. The 95% confidence intervals are drawn by the error bars. Each subfigure contains the evolution of training/testing AUCs with increasing feature robustness filtering thresholds for one dataset and prediction outcome. A decreasing trend of training AUCs were observed with increasing thresholds for all the datasets, prediction outcomes, and classifiers. The testing AUCs remain stable except for local-regional recurrence prediction on HN-PETCT dataset.

