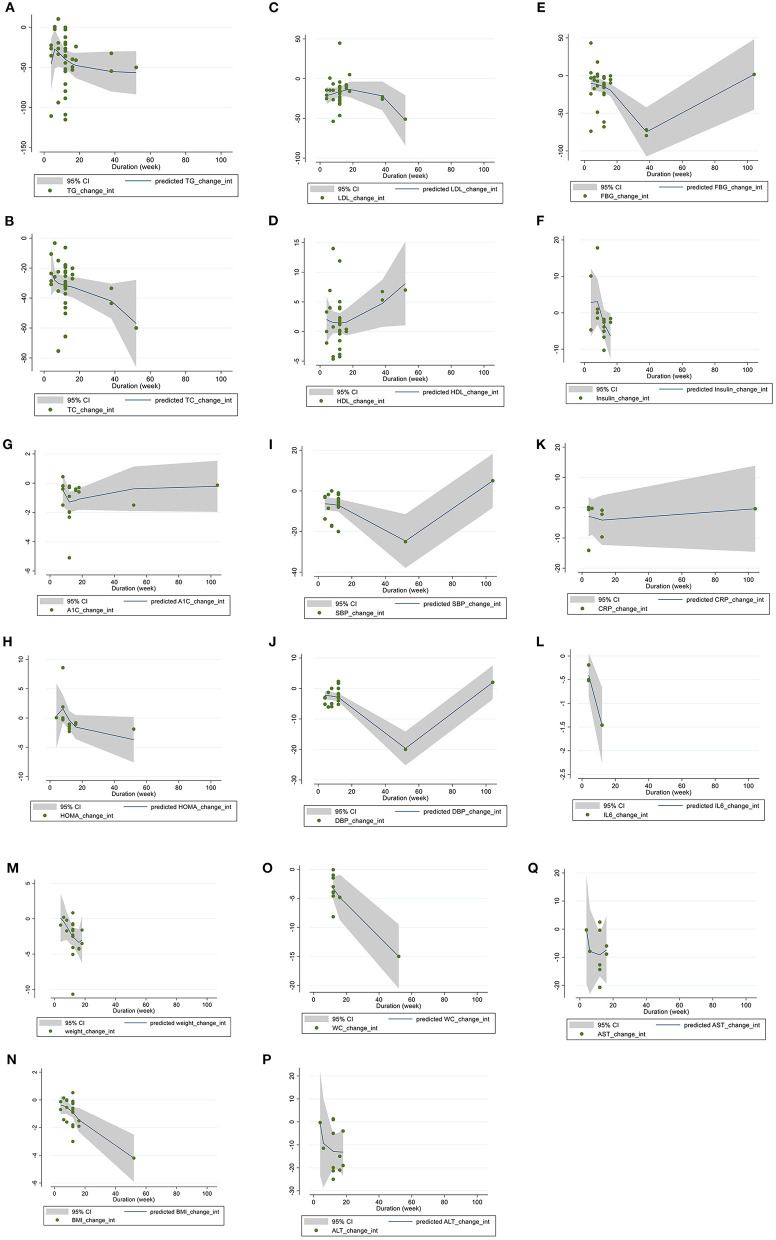
Figure 7.
Non-linear dose-response relations between berberine consumption and absolute mean differences. Dose-response relations between duration of intervention (week) and absolute mean differences in (A) TG (mg/dl); (B) TC (mg/dl); (C) LDL (mg/dl); (D) HDL (mg/dl); (E) FBG (mg/dl); (F) Insulin (mg/dl); (G) HbA1c (%); (H) HOMA-IR; (I) SBP (mmHg); (J) DBP (mmHg); (K) CRP (mg/L); (L) IL-6 (ng/L); (M) weight (kg); (N) BMI (kg/m2); (O) WC (cm); (P) ALT (U/L); and (Q) AST (U/L). TG, triglyceride; TC, total cholesterol; LDL, low-density lipoprotein; HDL, high-density lipoprotein; FBG, fasting blood glucose; HOMA-IR, homeostasis model assessment for insulin resistance; hemoglobin A1c, HbA1c; CRP, C-reactive protein; IL-6, interleukin 6; WC, waist circumference; ALT, alanine transaminase; AST, aspartate transaminase; SBP, systolic blood pressure; DBP, diastolic blood pressure.

