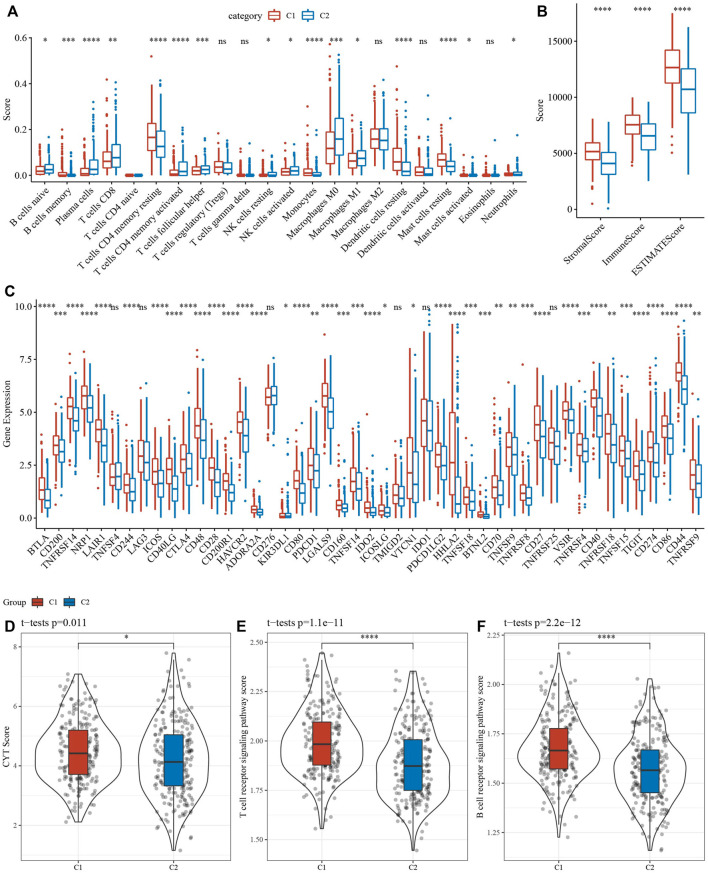
FIGURE 6.
Analysis of immune infiltration. (A) analysis of 22 immune cells using CIBERSORT. (B) Analysis of immune infiltration using ESTIMATE. (C) The expression levels of 42 immune check genes between C1 and C2. (D–F) The differences of CTY score, T cell receptor signaling pathway score, B cell receptor signaling pathway score between C1 and C2. *p < 0.05, **p < 0.01, ***p < 0.001, ***p < 0.0001, ns: no significance.

