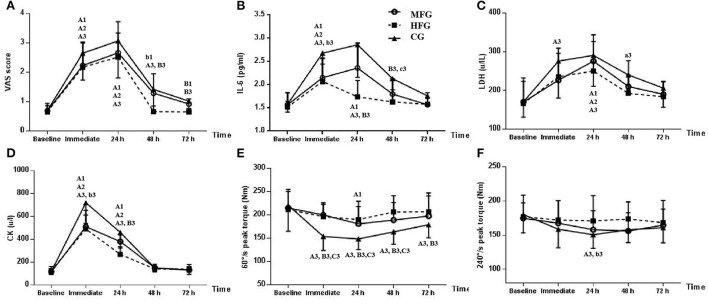
Figure 1.
Changs in the three groups at different time points. MFG, medium-frequency group; HFG, high-frequency group; CG, control group. Values at different time points were compared with the baseline in the same group: a1 (MFG), a2 (HFG), and a3 (CG) indicate P < 0.05; A1 (MFG), A2 (HFG), and A3 (CG) indicate P < 0.01. MFG or CG was compared with HFG at the same point in time: b1 (MFG) and b3 (CG) indicate P < 0.05. B1 (MFG) and B3 (CG) indicate P < 0.01. CG was compared with MFG at the same point in time. c3 (CG) indicates P < 0.05. (A) VAS score. (B) IL-6. (C) LDH. (D) CK. (E) 60 °/s peak torque. (F) 240 °/s peak torque.

