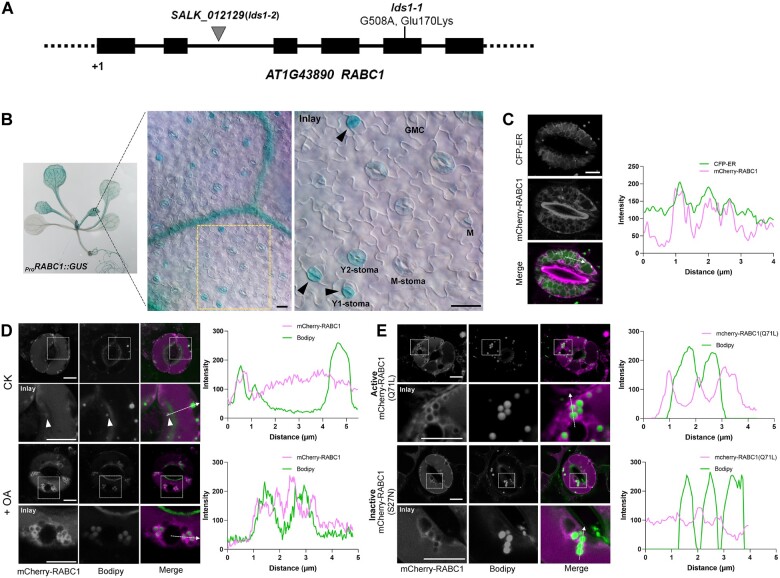
Figure 2.
LDS1/RABC1 is highly expressed in young stomata and RABC1 targets to the surface of LDs. A, Schematic view of mutation site determination of two independent lines of lds1 mutants. B, GUS staining of a 2-week-old seedling of ProRABC1:GUS transformant. RABC1 is highly expressed in leaf veins and SLCs. The inset image shows that RABC1 is highly expressed in young GCs. Arrowheads indicate Y1-stomata. M (meristemoid), GMC, Y1 (young1), Y2 (young2), M (mature) -stoma. Scale bars, 20 μm. C, mCherry-RABC1 transformants were used to determine whether RABC1 localized to the ER. mCherry-RABC1 co-localized with CFP-ER. The fluorescence intensity profile plot of mCherry-RABC1 and CFP-ER is quantified along the dotted arrow. Scale bar, 5 μm. D, mCherry-RABC1 transformants were used to determine the relationship between RABC1 localization and LDs. Oleic acid (OA) application induces LD production. Arrowheads indicate ring-like signals surrounding LDs. The fluorescence intensity profile plots of mCherry-RABC1 and Bodipy were quantified along the dotted arrows, respectively. Scale bar, 5 μm. E, Activity status of RABC1 dictates the subcellular localization of RABC1. The fluorescence intensity profile plots of mCherry-RABC1 and Bodipy were quantified along the dotted arrows, respectively. Scale bar, 5 μm.

