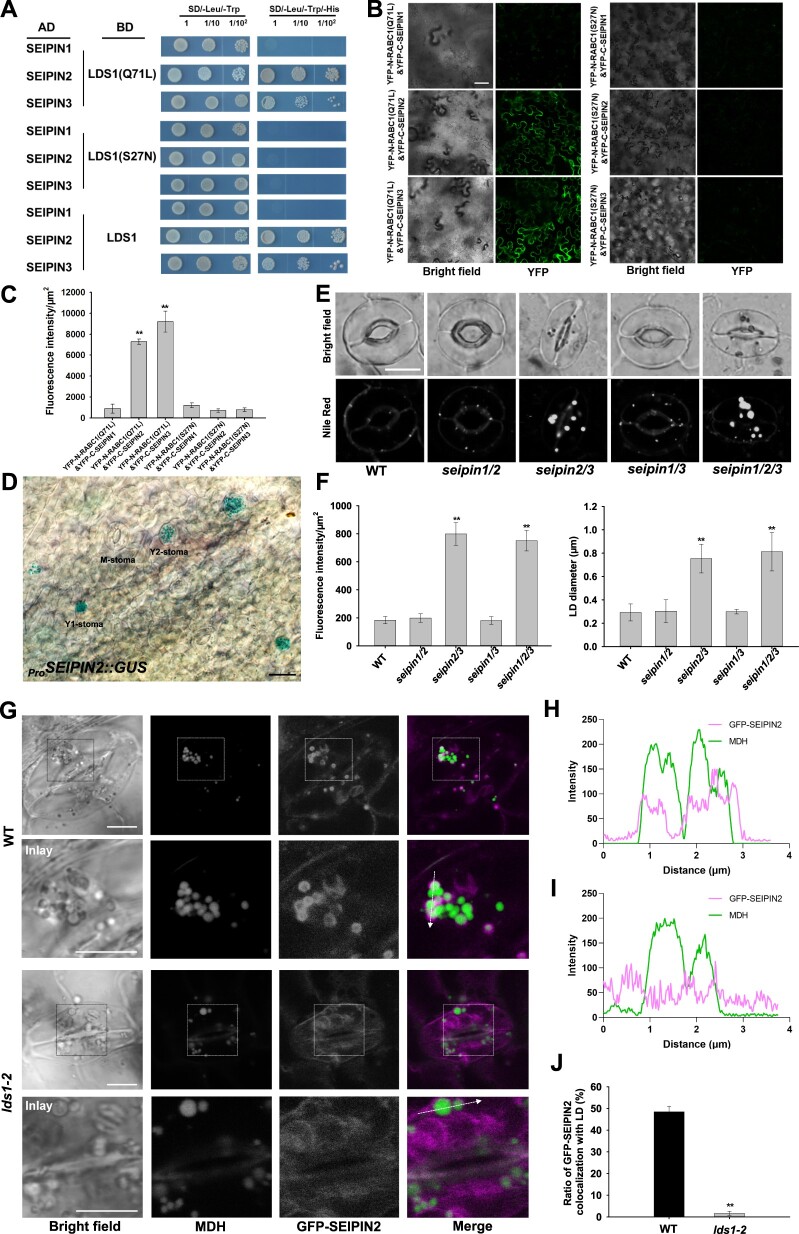
Figure 4.
SEINPIN2 and SEIPIN3 are two effectors for RABC1. A, Interaction tests between SEIPINs and different status RABC1 in Y2H system. B, Interaction tests between SEIPINs and different status RABC1 in BiFC tests. Scale bar, 50 μm. C, Fluorescence intensity of YFP in (B) was quantified. Data are shown as means ± SD, n = 3. Asterisks represent Student’s t test significance (**P < 0.01). D, GUS staining of leaves from 2-week-old seedling of ProSEIPIN2:GUS transformant. SEIPIN2 is highly expressed in stomatal cells. Scale bar, 20 μm. E and F, Simultaneous disruption of SEIPIN2 and SEIPIN3 resulted in defective LD dynamics, aberrant LD size, and stomatal morphology. The representative stomatal images were single confocal planes from young leaves of 4-week-old plants (E). LD abundance and size of GCs were quantified (F). Data are shown as means ± SD, n = 20. Asterisks represent Student’s t test significance (**P < 0.01). Scale bar, 10 μm. G, Localization of GFP-SEIPIN2 to LDs is blocked by RABC1 deficiency. The LDs were stained with Monodansylpentane (MDH). Scale bar, 5 μm. H and I, Fluorescence intensity profile plots of GFP-SEIPIN2 and LDs in WT (H) and lds1-2 (I) are quantified along the dotted arrow in (G). J, Quantification of the proportion of GFP-SEIPIN2 localized on LDs in WT and lds1-2. Data are shown as means ± SD, n = 120. Asterisks represent Student’s t test significance (**P < 0.01).

