Figure 6.
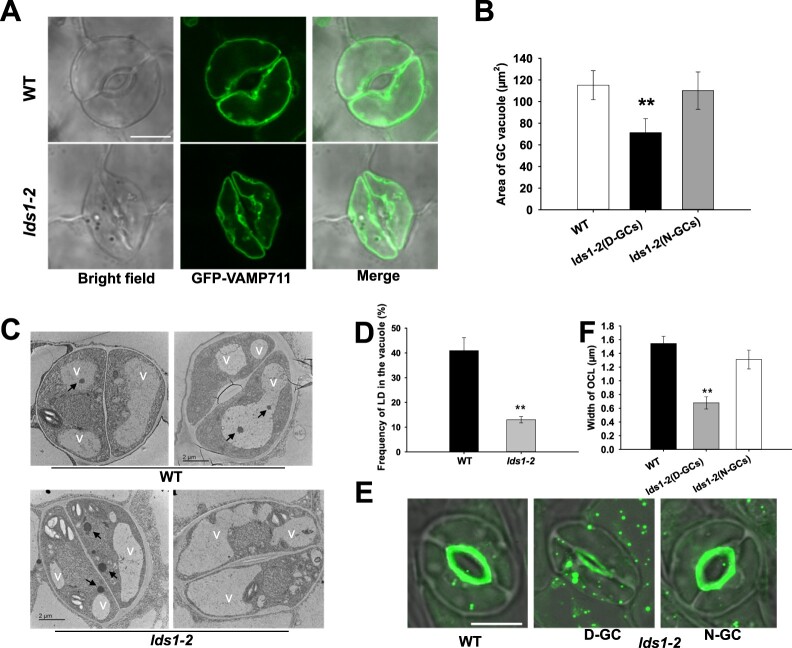
Disruption of RABC1 function affects vacuole occupancy and OCL formation. A, Representative images of vacuoles in GCs of WT and lds1 plants. The representative stomatal images were single confocal planes from young leaves of 4-week-old plants. Scale bar, 10 μm. B, Quantification of the area of vacuoles in GCs of WT and lds1 plants. Data are shown as means ± SD, n = 50. Asterisks represent Student’s t test significance (**P < 0.01). C and D, The number of LDs in the vacuolar lumen of lds1 was reduced compared with WT. Representative TEM images of LDs in the vacuolar lumen (C), quantification of LDs in the vacuolar lumen (D). Arrows indicate LDs. V, vacuole. Data are shown as means ± SD, n = 30. Asterisks represent Student’s t test significance (**P < 0.01). E and F, The OCL of deformed GCs in lds1-2 is much thinner and narrower. The representative stomatal images were single confocal planes from young leaves of 4-week-old plants. Data are shown as means ± SD, n = 40. Asterisks represent Student’s t test significance (**P < 0.01).

