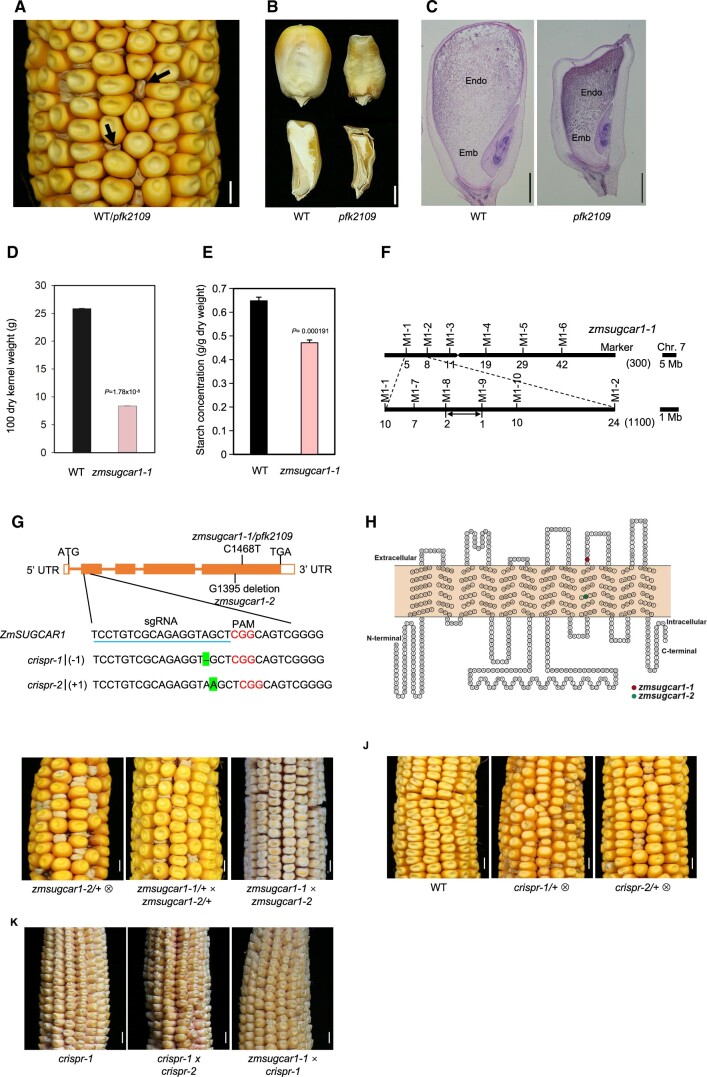
Figure 1.
Mutant-kernel phenotypes and map-based cloning of ZmSUGCAR1. A, Segregation of the pfk2109 phenotype in a maize ear at 45 DAP. The magnification highlighted poorly filled kernels with empty pericarps (arrows). B, Mature kernels (upper panel) with sagittal sections (lower panel) of WT (left) or pfk2109 (right). C, Histological analysis of WT or pfk2109 kernels at 20 DAP, stained with eosin. Emb, embryo; Endo, endosperm. D, 100 grain weight of WT and zmsugcar1-1 lines at 45 DAP. E, Starch measurement of WT and zmsugcar1-1 kernels at 45 DAP. F, Map-based cloning of the ZmSUGCAR1 variant. The ZmSUGCAR1 was located between the molecular markers M1-8 and M1-9 on chromosome 7. Molecular markers and number of recombinants were indicated, respectively. G, Gene structure of ZmSUGCAR1 and mutation sites of different zmsugcar1 mutant lines. The filled boxes represented exons and the lines represented introns. The point mutation (C1468T) in zmsugcar1-1 and single base-pair deletion (G1395 deletion) in zmsugcar1-2 were shown on the gene-structure diagram. The sgRNA target sequence was underlined and the PAM motif was colored. The single base pair (A) deletion of the crispr-1 allele and a single base pair (A) insertion of the crispr-2 allele were highlighted. H, A 2-D schematic of ZmSUGCAR1 based on OCTOPUS (http://octopus.cbr.su.se/) prediction transmembrane (TM) secondary structure. The red and green colored amino acid was prematurely stopped, respectively, in the zmsugcar1-1 and zmsugcar1-2 mutant. I, A representative self-pollinated ear of zmsugcar1-2 heterozygotes (left) and allelic tests using heterozygotes (middle) and homozygotes (right) of zmsugcar1-1 and zmsugcar1-2. J, The phenotype and genetic test of two independent crispr mutant lines. Representative self-pollinated ears of WT (left) and crispr-1 (middle) and crispr-2 (right) heterozygotes. K, The allelic test of zmsugcar1-1 and crispr-1 (left) mutants. The offspring annotated as crispr1 × crispr-2 (middle) and zmsugcar1-1 × crispr-1 (right). Scale bars, 5 mm for A, I, J, and K and 1 mm for B and C. P < 0.05 indicated significant differences between WT and mutant lines.

