Figure 5.
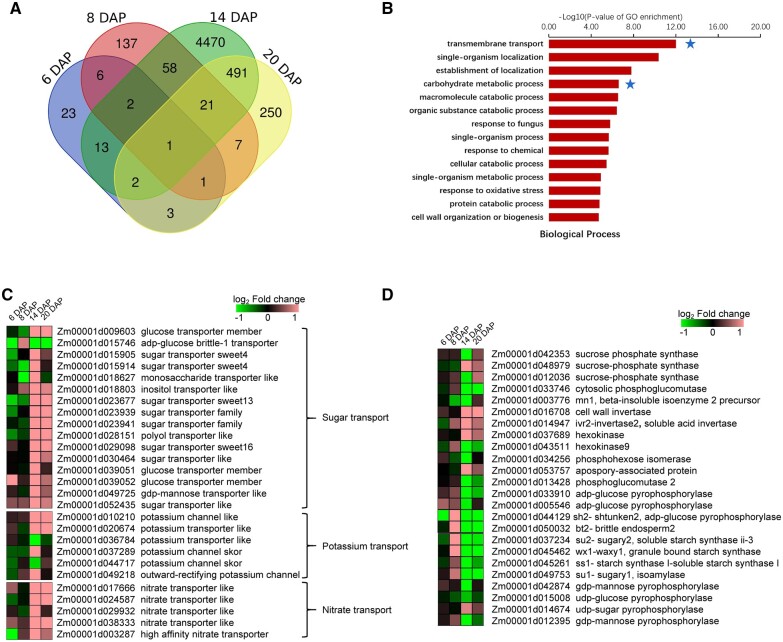
Transcriptome profiling showing gene differential expression and GO term enrichment during early grain development in WT and zmsugcar1-1. A, Venn diagram of DEGs in WT and zmsugcar1-1 kernels at 6, 8, 14, and 20 DAP. B, GO term enrichment analysis of up-regulated genes in the biological process in WT and zmsugcar1-1 kernels at 20 DAP. The stars indicated enrichment of genes involved in TM transport and carbohydrate metabolism. C and D, Heat mapping of differential expression of sugar, potassium, and nitrate transporters (C) and sugar and starch metabolism-related genes (D) in WT and zmsugcar1-1 kernels at 6, 8, 14, and 20 DAP.

