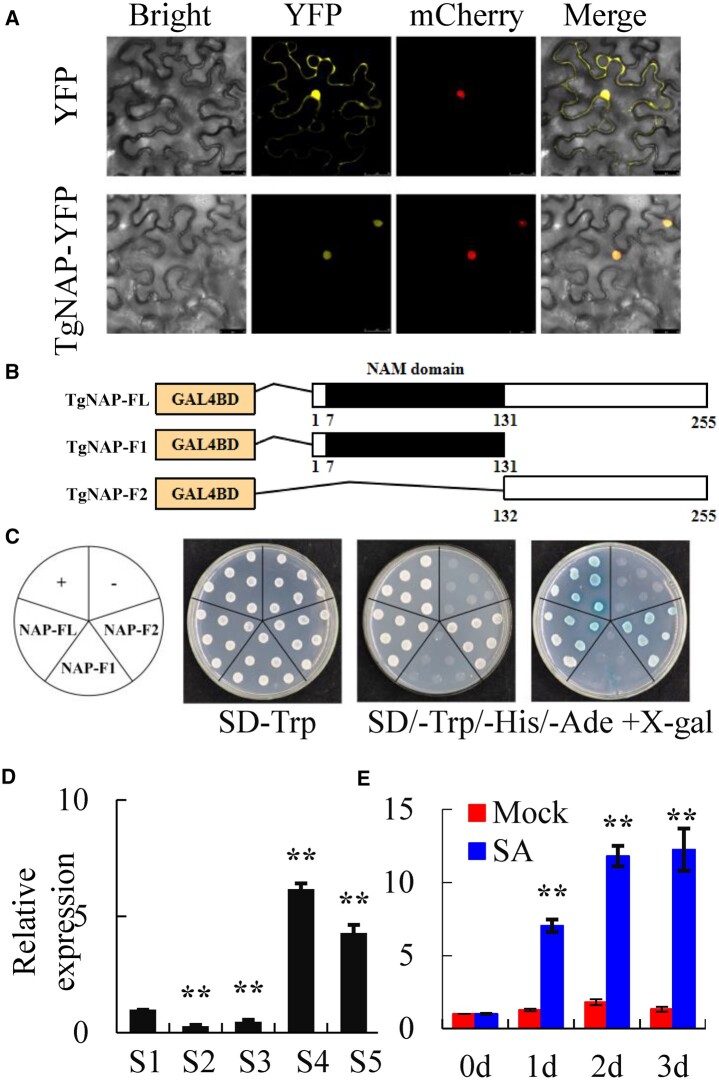
Figure 2.
Characterization of TgNAP during petal senescence in T. gesneriana. A, Subcellular location of TgNAP. The fusion construct TgNAP-YFP or YFP empty vector was co-transformed with VirD2NLS-mCherry (a nucleus marker) in N. benthamiana leaves. Confocal microscopic images showed bright field, yellow (for YFP), red (for mCherry) fluorescence signals in epidermal cells. Scale bars = 25 μm. B, Schematic diagrams of the full length (FL) and two truncated fragments (F1 and F2) of TgNAP used for constructing vectors. All constructed vectors were introduced in pGBKT7 vector with GAL4 DBD domain. The numbers below the bars indicate the positions of amino acid. C, Transcription activity assay. Growth of yeast cell (AH109 strain) transformed with various constructed vectors on SD/-Trp and SD/-Trp/-His/-Ade with or without X-α-gal selective medium. Transformation of pGBKT7-p53 and pGBKT7 vector was used as a positive and negative control, respectively. D and E, RT-qPCR analysis of TgNAP expression levels in T. gesneriana during petal senescence (D) or treated with 200 μM SA for 3 d (E). S1–S5 are abbreviations of first stage to fifth stage. The expression levels of the samples at the indicated time point were normalized to a TgUBQ10-like gene. Relative gene expression was calculated using the 2–ΔΔCt method. Error bars represent ± SE (n = 3). Asterisks indicate significant difference between WT and two transgenic lines based on the LSD values (**P < 0.01).

