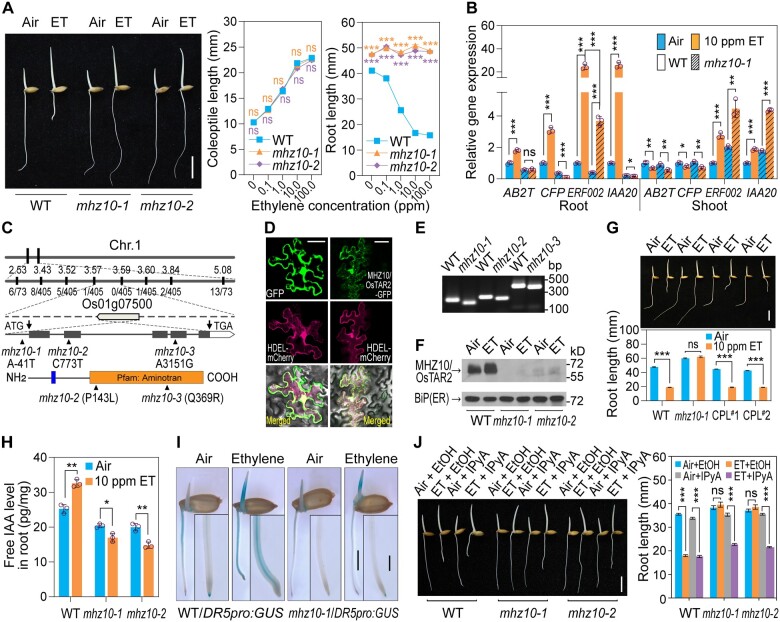
Figure 1.
Phenotype of mhz10 mutants and cloning of MHZ10/OsTAR2. A, Ethylene-response phenotype of mhz10. Representative seedlings grown in air or 10 ppm ethylene for 2.5 DAG are shown, scale bar, 10 mm. Data are means ± se (n ≥ 21). B, Expression of ethylene-responsive genes analyzed by RT-qPCR. One-DAG etiolated seedlings were treated with or without 10 ppm ethylene for 8 h. Three independent biological replicates were performed. Data are means ± sd. C, Map-based cloning of MHZ10/OsTAR2. Mutation sites and putative protein domains are shown in schematic diagrams. The first narrow box indicates a putative transmembrane domain and the second large box indicates a putative aminotransferase domain. Three allelic mutants are indicated, with two mutation sites in the coding region, and one upstream of the coding region. D, Subcellular localization of MHZ10/OsTAR2. ER-located protein HDEL-mCherry was used as a marker. More than 10 cells in different regions of infiltrated leaves were observed, and representative cells are shown. Scale bars, 20 μm. E, Identification of three allelic mutation sites in the genome by dCAPS. F, Immunoblot assay for MHZ10/OsTAR2 protein in roots. One-DAG etiolated seedlings were treated with or without 10 ppm ethylene for 12 h. MHZ10/OsTAR2 abundance in root tips (5 mm apical part of the roots) was analyzed with an antibody raised against MHZ10/OsTAR2. ER-located binding immunoglobulin protein served as a loading control. G, Phenotypic rescue by introducing a MHZ10/OsTAR2 genomic fragment into the mhz10-1 mutant. CPL, functional complemented line. Scale bar, 10 mm. Data are means ± se (n ≥ 18). H, Free IAA levels in roots in response to ethylene. Data are means ± sd (n = 3). I, GUS staining assay for ethylene-induced Aux in etiolated seedlings. DR5 promoter-driven GUS expression reflects Aux signaling output. Scale bar, 4 mm. Insets show enlargement of root tips, with scale bar, 1 mm. J, Effects of IPyA treatment on root length of mhz10 in ethylene response. Scale bar = 10 mm. Data are means ± se (n ≥ 21). *P < 0.05; **P < 0.01; ***P < 0.001, as determined by a two-tailed Student’s t test compared to the corresponding control. Source data are provided in Supplemental Data Set 2.

