Figure 1.
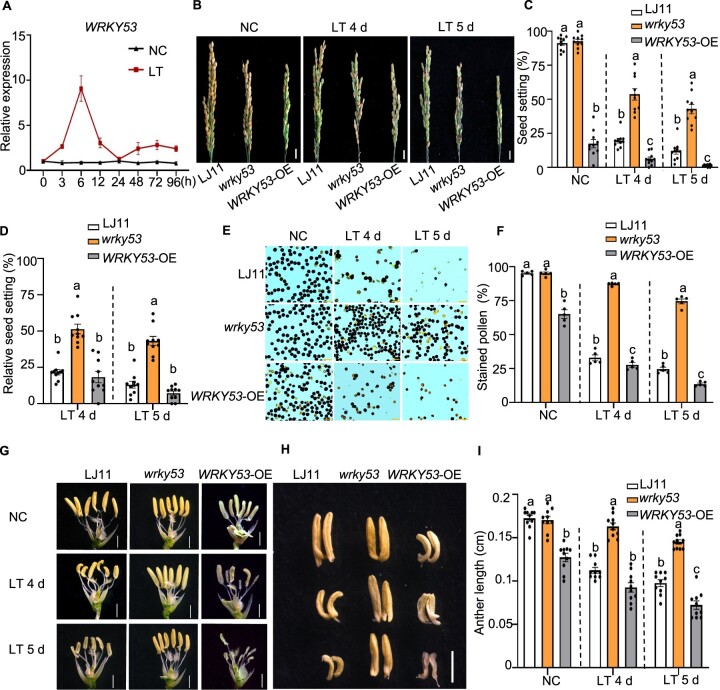
WRKY53 negatively regulates CTB stage in rice. A, Time course of WRKY53 relative expression levels in panicles of the cultivar LJ11 exposed to a 15°C cold treatment during the booting stage. The expression level on day 0 was set to 1. Data are shown as means ± se (n = 3). B–D, Representative images of panicles (B), seed setting rate (C), and relative seed setting rate (D) of LJ11, wrky53, and WRKY53-OE plants grown under NCs and after 4 or 5 days of LT. Scale bar, 1 cm. Data are shown as means ± se (n = 10). E and F, Pollen fertility (E) and stained pollen ratio (F) of LJ11, wrky53, and WRKY53-OE pollen from plants grown under NC or after 4 and 5 days of LT. Scale bar, 20 μm. Data are shown as means ± se (n = 5). G, Gross morphology of anthers from LJ11, wrky53, and WRKY53-OE plants grown under NC or after 4 or 5 days of LT. Scale bar, 1 mm. H and I, Anthers (H) and anther length (I) in LJ11, wrky53, and WRKY53-OE plants grown under NC or after 4 or 5 days of LT. Scale bar, 1 mm. Data are shown as means ± se (n = 10). Dotted lines separate NC and LT treatments, and the comparisons are among different genotypes in the same treatment. Each dot represents the result from one biological replicate, error bars indicate means ± se. Significant differences are indicated by different lowercase letters (P < 0.05, one-way ANOVA with Tukey’s significant difference test).

