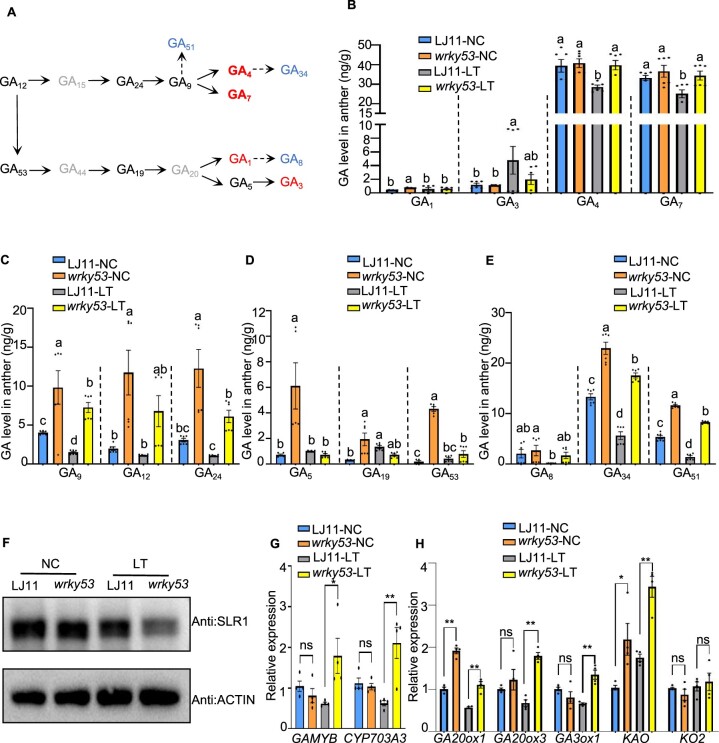
Figure 3.
WRKY53 negatively regulates GA content and GA biosynthesis gene expression in anthers. A, Schematic diagram of the GA-biosynthetic pathway. Undetected GAs are shown in gray, bioactive GAs are in red, and inactivated GAs are in blue. B, C, D, and E, GA contents in developing anthers of LJ11 and wrky53 plants grown under NC or LT. The concentrations and identity of endogenous GAs were determined using a Thermo Scientific Ultimate 3000 UHPLC. Data are shown as means ± se (n = 6). Dotted lines separate treatments and the comparisons are among different genotypes in the same treatment. Each dot represents the result from one biological replicate. Significant differences are indicated by different lowercase letters (P < 0.05, one-way ANOVA with Tukey’s significant difference test). F, SLR1 protein abundance in panicles of LJ11 and wrky53 plants grown under NC or after 4 days of LT treatment, as detected by immunoblot with an anti-OsSLR1 antibody. ACTIN, detected with anti-ACTIN antibody, was used as the loading control. G, Relative expression levels of GAMYB and CYP703A3 in developing panicles of LJ11 and wrky53 plants grown under NC or after 4 days of LT treatment. Data are shown as means ± se (n = 4). H, Relative expression levels of GA biosynthesis genes in developing panicles of LJ11 and wrky53 plants grown under NC or after 4 days of LT treatment. Data are shown as means ± se (n = 4). Each dot represents the result from one biological replicate. P-values were calculated by Student’s t test: **P < 0.01, *P < 0.05, and ns indicates no significant difference.

