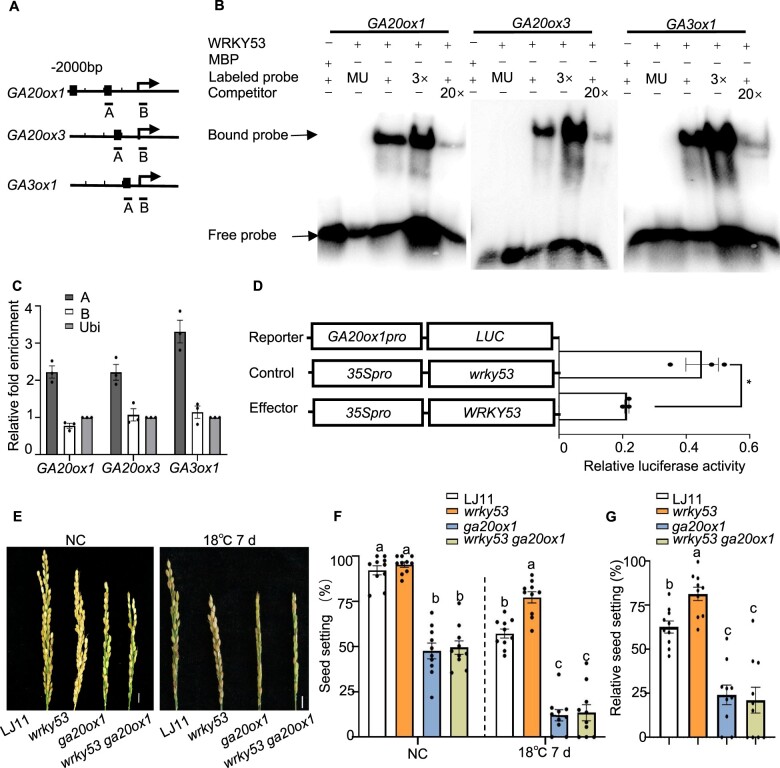
Figure 5.
WRKY53 binds to the promoters of GA biosynthesis genes and represses their transcription. A, Schematic diagrams of the GA20ox1, GA20ox3, and GA3ox1 promoters. The arrows indicate the position of the translation start codon. Scale, 500 bp. DNA fragments (A and B) were used for ChIP and the black squares indicate the W-box regions (T)TGACC. B, EMSA showing that WRKY53 binds to the conserved W-box of the GA20ox1, GA20ox3, and GA3ox1 promoters. A 52-bp W-box sequence containing DNA fragments in the A region in (A) was used as a probe. Versions of the probe with the W-box mutated to AAAAAA served as mutant probes; unlabeled probes served as competitive probes. MBP was used as a negative control. C, ChIP assays showing that WRKY53 binds to the promoters of GA20ox1, GA20ox3, and GA3ox1 in vivo. Immunoprecipitation was performed with anti-OsWRKY53 antibody. Immunoprecipitated chromatin was analyzed by qPCR using primers indicated in (A). qPCR enrichment was calculated by normalizing to ACTIN and to the total input of each sample. Data are shown as means ± se (n = 3). D, Transient assay in rice protoplasts showing that WRKY53 suppresses the transcription of GA20ox1. Schematic diagrams of the effector and reporter plasmids are indicated. The mutated WRKY53 coding sequence in wrky53, causing a frameshift in the coding sequence, was used as the control. Reporter together with control (35Spro:wrky53) or 35Spro:WRKY53 effector constructs were transfected into rice protoplasts. Relative LUC activity was calculated as the ratio between firefly LUC and REN LUC. Data are shown as means ± se (n = 3). Each dot represents the result from one biological replicate and error bars indicate means ± se. P-values were calculated by Student’s t test, *P < 0.05. E, F, and G, Representative images of panicles (E), seed setting rate (F), and relative seed setting rate (G) of LJ11, wrky53, ga20ox1, and wrky53 ga20ox1 mutants grown under NC and after LT stress. Scale bar is 1 cm. Data are shown as means ± se (n = 10). Dotted lines were drawn to separate treatments, and comparisons are among different genotypes in the same treatment. Each dot represents the result from one biological replicate. Significant differences are indicated by different lowercase letters (P < 0.05, one-way ANOVA with Tukey’s significant difference test).

