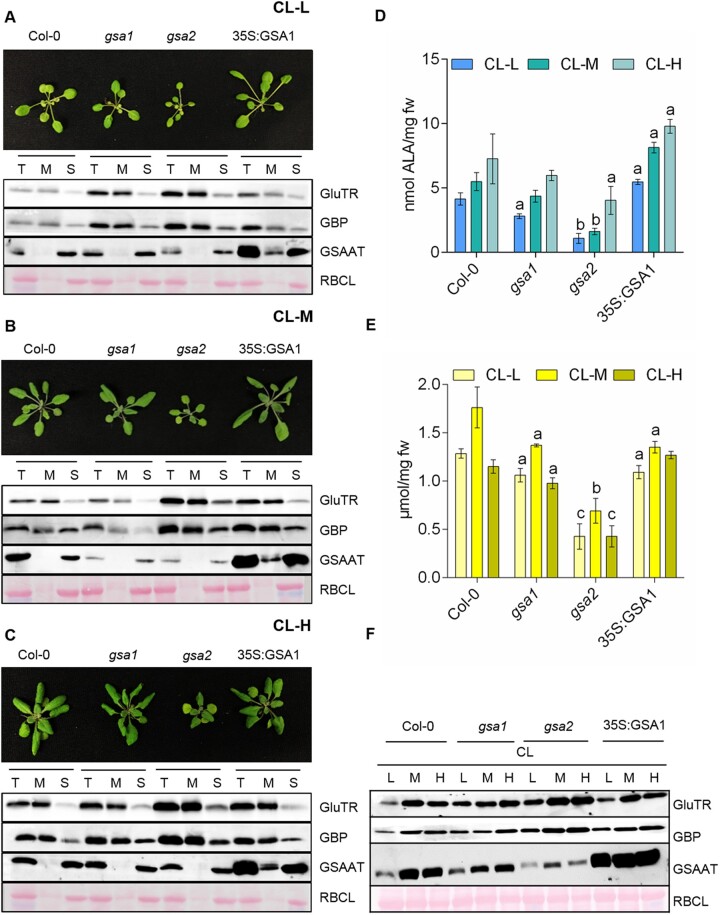
Figure 4.
Analysis of the wild-type, gsa1, gsa2 and 35S:GSA1(gsa2) lines under different light intensities. A–C, Top, 4-week-old seedlings of all four genotypes grown in CL under standard (CL-M; 120 µmol photons m−2 s−1), low (CL-L; 10 µmol photons m−2 s−1), and high light levels (CL-H; 300 µmol photons m−2 s−1). Bottom, immunoblot analysis of GluTR, GBP, and GSAAT in crude plastid extract (T), membrane (M), and stroma (S) fractions. (D) GSAAT activity in total leaf extracts from the four indicated genotypes exposed to the three different light intensities, CL-L, CL-M, and CL-H. E, Chlorophyll a and b contents. For (D) and (E), data represent the standard error of biological replicates from three different harvests. The statistical significance was performed using Student’s t test, when aP ≤ 0.05, bP ≤ 0.01, and cP ≤ 0.001 mentioned in Supplemental Data Set S1; fw, fresh weight. F, Immunoblot analysis of the indicated proteins in each of the four genotypes under CL in all three light intensities (L, low, M medium/standard, H high). In (A–C) and (F), the Ponceau-stained large subunit of RuBisCO (RBCL) served as a loading control.

