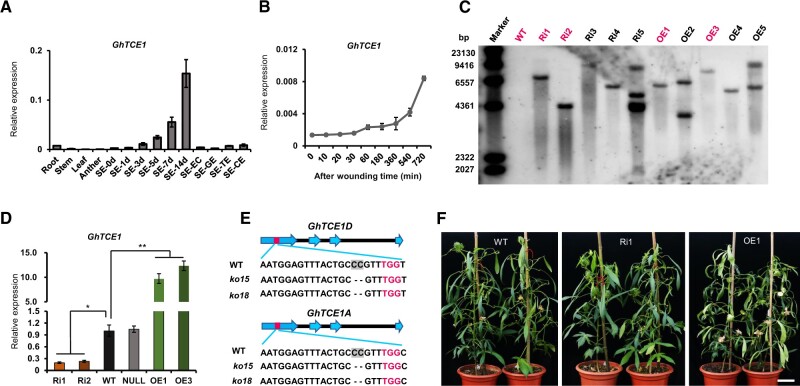
Figure 1.
Analysis of GhTCE1 expression and characterization of transgenic plants. A, Expression pattern of GhTCE1 in different tissues. SE-0d, -1d, -3d, -5d, -7d, or -14d means the explants of hypocotyls were induced for 1, 3, 5, 7, or 14 days during SE (embryogenic callus [SE-EC], globular stage embryo [SE-GE], torpedo stage embryo [SE-TE], and cotyledon stage embryo [SE-CE]). B, Expression pattern of GhTCE1 soon after wounding. The expression of GhUB7 was used as internal control. C, Immunoblot analysis of GhTCE1 transgenic lines. The first lane represents the λ DNA size marker. The DNA samples were digested with HindIII. The magenta front indicates the selected lines for study. D, Relative expression of GhTCE1 in transgenic lines 7 days post SE induction. WT, wild type; Ri1 and Ri2, Ri lines; OE1 and OE3, OE lines. Null, negative plants segregated from Ri1 in the T1 generation. The expression of GhUB7 was used as internal control. E, Sequence analysis of GhTCE1(A/D) double mutants ko15 and ko18 at the target sites. The PAM motif is marked in magenta and GhTCE1A and GhTCE1D can be distinguished by the SNP C/T (marked in green) downstream of the PAM motif. The black dotted line represents deletion compared with WT. F, Phenotypes of GhTCE1 transgenic plant lines grown on soil. Bars = 20 cm. Error bars in (A), (B), and (D) represent ± standard error of three biological replicates (∼20 explants were used as one replicate). Significance tests compared each transgenic line with WT plants. *P < 0.05, **P < 0.01, Supplemental Data Set S2.

