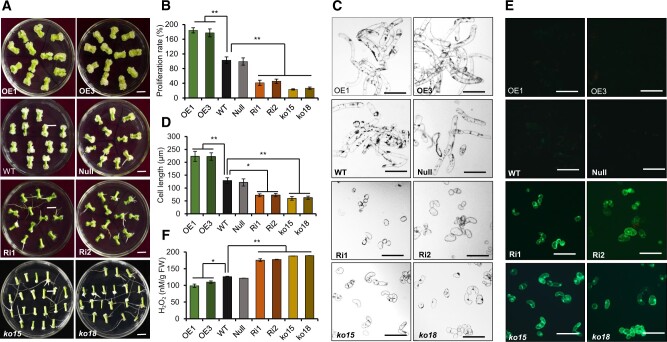
Figure 2.
Phenotypic analysis of GhTCE1 transgenic tissues. A, The phenotypes of callus 20 days post wounding from different transgenic lines and mutants. ko15 and ko18, mutation lines. B, CPR of different lines 20 days post wounding. Error bars represent ± standard error of six biological replicates (∼20 explants each). C, Micrographs of callus cells of different lines 20 days post wounding. Bars = 200 μm. D, Statistical analysis of callus cells length of different lines 20 days post wounding. Error bars represent ± standard error of six biological replicates (∼50 cells each). E, DCFH-DA staining of ROS in GhTCE1 transgenic plants and mutants. F, H2O2 concentration in callus from GhTCE1 transgenic plants 20 days post wounding. Error bars represent ± standard errors of four biological replicates (∼20 explants each). Significance tests compared each transgenic line with WT plants. *P < 0.05, **P < 0.01, Supplemental Data Set S2.

