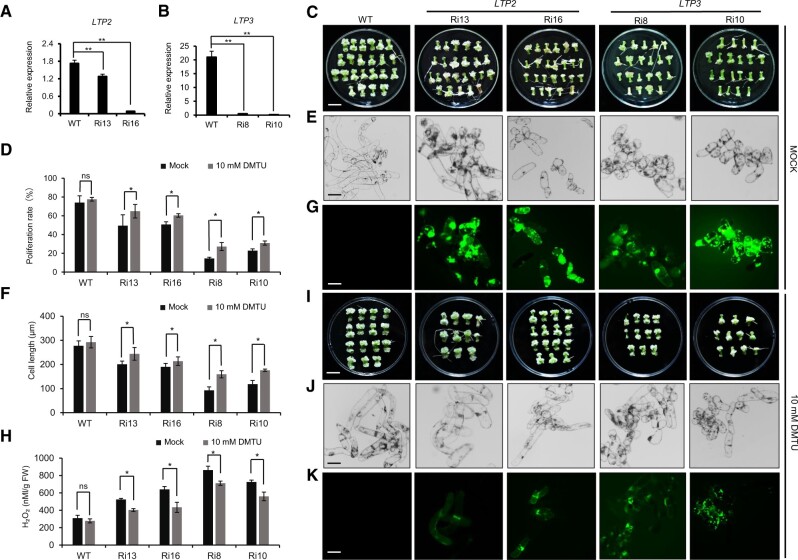
Figure 5.
Phenotypic analysis of GhLTP2 and GhLTP3 Ri transgenic tissues. A and B, Relative expression of GhLTP2 and GhLTP3 in WT and respective Ri transgenic lines. Error bars represent ± standard error of three biological replicates as described in Figure 1A. C, Phenotype of callus 20 days post wounding for different transgenic lines following mock treatment. Bar = 1 cm. D, CPR of different lines 20 days post wounding following mock treatment or treatment with 10 mM DMTU. Error bars represent ± standard error of six biological replicates as described in Figure 2B. E, Micrographs of callus cells, under mock treatment. Bar = 100 μm. F, Statistic analysis of callus cell lengths of different lines 20 days post wounding under mock treatment and 10 mM DMTU. Error bars represent ± standard error of six biological replicates as described in Figure 2D. G, DCFH-DA staining of ROS in WT, GhLTP2, and GhLTP3 transgenic callus cells. Bar = 100 μm. H, H2O2 concentration in callus from transgenic plants 20 days post SE induction. Error bars represent ± standard errors of three biological replicates as described in Figure 2F. I–K, Phenotype, micrograph, and DCFH-DA staining of ROS in callus cells, 20 days post wounding from different transgenic lines under 10 mM DMTU treatment. Bar = 1 cm in I and 100 μm in J and K. Significance tests compared each transgenic line with WT plants. *P < 0.05, **P < 0.01. Results of statistical analyses are presented in Supplemental Data Set S2.

