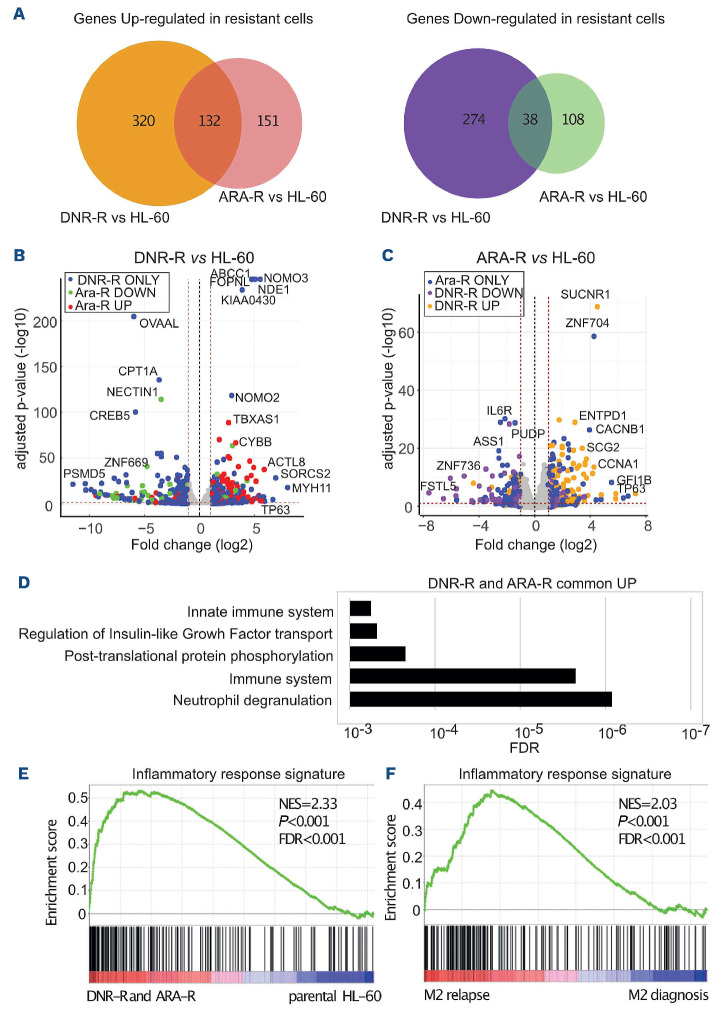
Figure 1.
Transcriptional reprogramming upon acquisition of chemoresistance by HL-60 acute myeloid leukemia cells. RNA-sequencing was performed on mRNA purified in three independent experiments conducted with HL-60 cells and their derived cytarabine-resistant (ARA-R) and daunorubicin-resistant (DNR-R) populations. (A) Venn diagram for upregulated (>2 fold, false decision rate [FDR] <0.05) and downregulated (>2 fold, FDR <0.05) genes in ARA-R and DNR-R cells compared to parental HL-60 cells. (B) Volcano plot for differentially expressed genes (DEG) between DNR-R and HL-60 cells. Blue dots correspond to the DEG in DNR-R but not in ARA-R cells, red dots to DEG in DNR-R cells that are upregulated in ARA-R cells and green dots to DEG that are downregulated in ARA-R cells. (C) Volcano plot for DEG between ARA-R and HL-60 cells. Blue dots correspond to the DEG in ARA-R but not in DNR-R cells, yellow dots to DEG in ARA-R cells that are upregulated in DNR-R cells and purple dots to DEG in ARA-R cells that are downregulated in DNR-R cells. (D) Gene ontology analysis of genes upregulated in both DNR-R and ARA-R cells compared to parental HL-60 cells. (E) Gene set enrichment analysis (GSEA) was performed using RNA sequencing data from ARA-R, DNR-R and parental HL-60 cells. The enrichment for the “inflammatory response” signature (175 genes) is shown. The normalized enrichment score (NES), nominal P-value and FDR are presented. (F) The inflammatory signature (175 genes) identified in (E) was used in GSEA with RNA-sequencing data from three patients from the FAB M2 subtype obtained from a publicly available cohort.22

