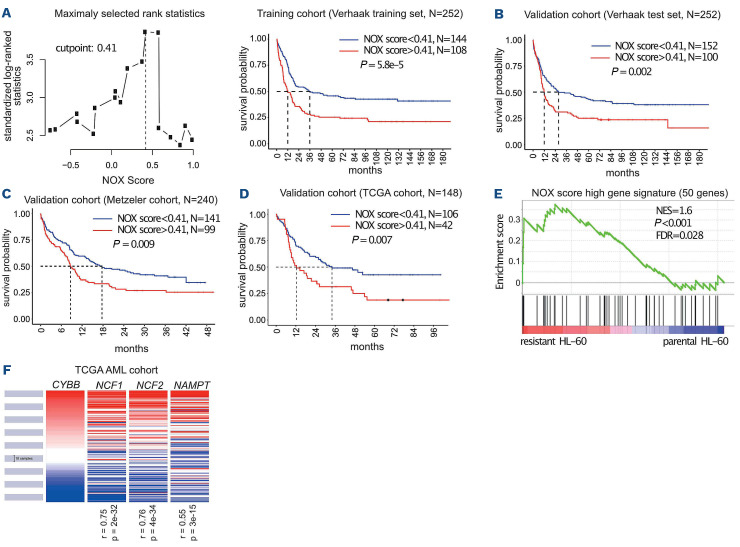
Figure 6.
Identification of a NOX score with prognostic value in acute myeloid leukemia. (A) Patients (n=252) of the Verhaak training cohort were ranked according to increasing NOX score. The cutpoint of 0.41 was selected using the MaxStat R function to obtain a maximum difference in overall survival between the two groups. Kaplan-Meier survival curves were established using the cutpoint value of 0.41 in the training cohort. (B-D) The NOX-score was validated in three independent cohorts using the 0.41 cutpoint. (E) Gene set enrichment analysis was performed using RNA sequencing data from chemoresistant cells compared to parental HL-60 cells. The gene list comprises the 50 most upregulated genes in the 10% of patients with the highest NOX score, compared to the 50% patients with the lowest NOX score in the Verhaak cohort. Normalized enrichment score and nominal P-value are presented. (F) Expression of CYBB, NCF1, NCF2 and NAMPT in 200 patients’ samples from The Cancer Genome Atlas cohort. R represents the Pearson rho correlation coefficient between the expression of NCF1, NCF2 or NAMPT and CYBB. TCGA: The Cancer Genome Atlas; NES: normalized enrichment score; FDR: false discovery rate.

