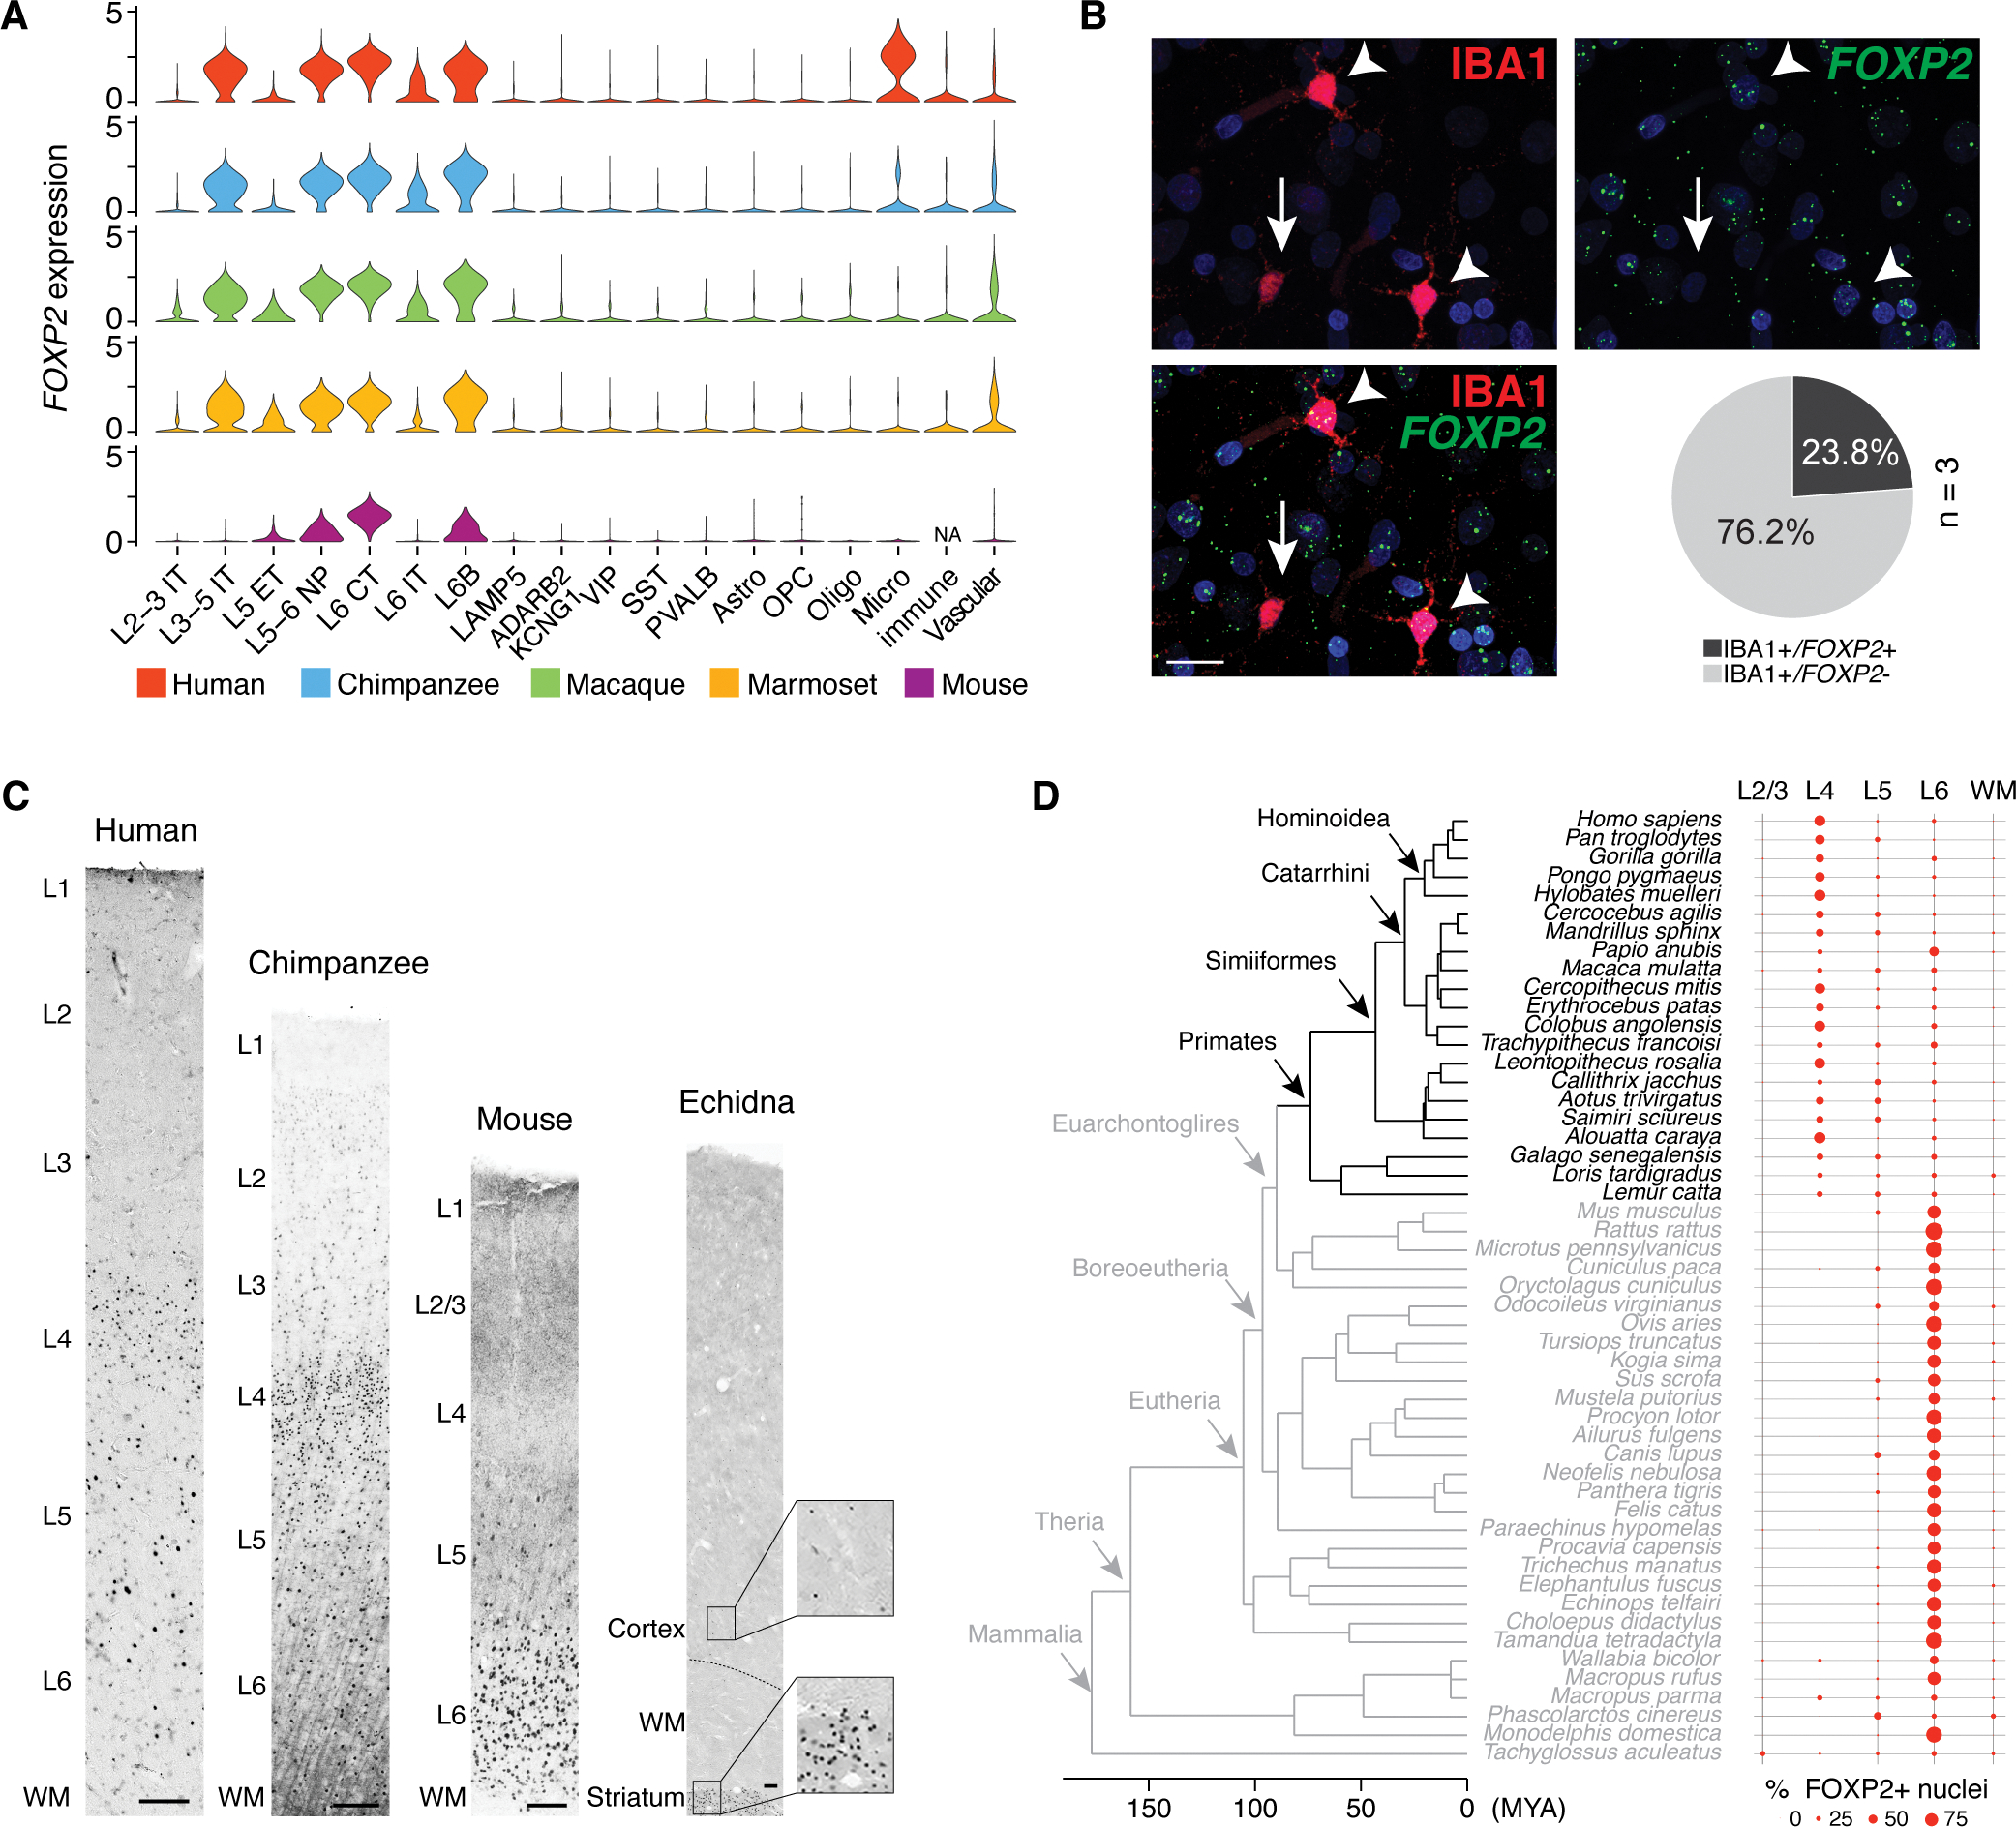
Fig. 6. Species- and cell type-specific expression of FOXP2.

(A) Violin plots of FOXP2 expression across all subclasses in the four primates and mouse neocortex (17). (B) Immunofluorescent staining against IBA1 (red) combined with RNA in situ hybridization for FOXP2 RNA (green) in L6 of human dlPFC. Arrowheads indicate FOXP2+/IBA1+ microglia, whereas the arrow indicates FOXP2−/IBA1+ microglia. The pie chart summarizes the proportion of FOXP2-expressing cells among IBA1-immunopositive cells. Nuclei are stained with DAPI (blue). Scale bar: 20 μm. (C) Representative images of FOXP2 immunohistochemistry throughout cortical columns in human, chimpanzee, mouse, and echidna. The position of layers and white matter (WM) are indicated. Insets for echidna highlight numerous FOXP2-immunopositive nuclei in the striatum and scarce FOXP2-immunopositive nuclei in the deep neocortical layers. Scale bars: 100 μm for all species. (D) Phylogeny dendrogram of the 51 mammals and their corresponding laminar distribution of FOXP2-immunopositive nuclei.
