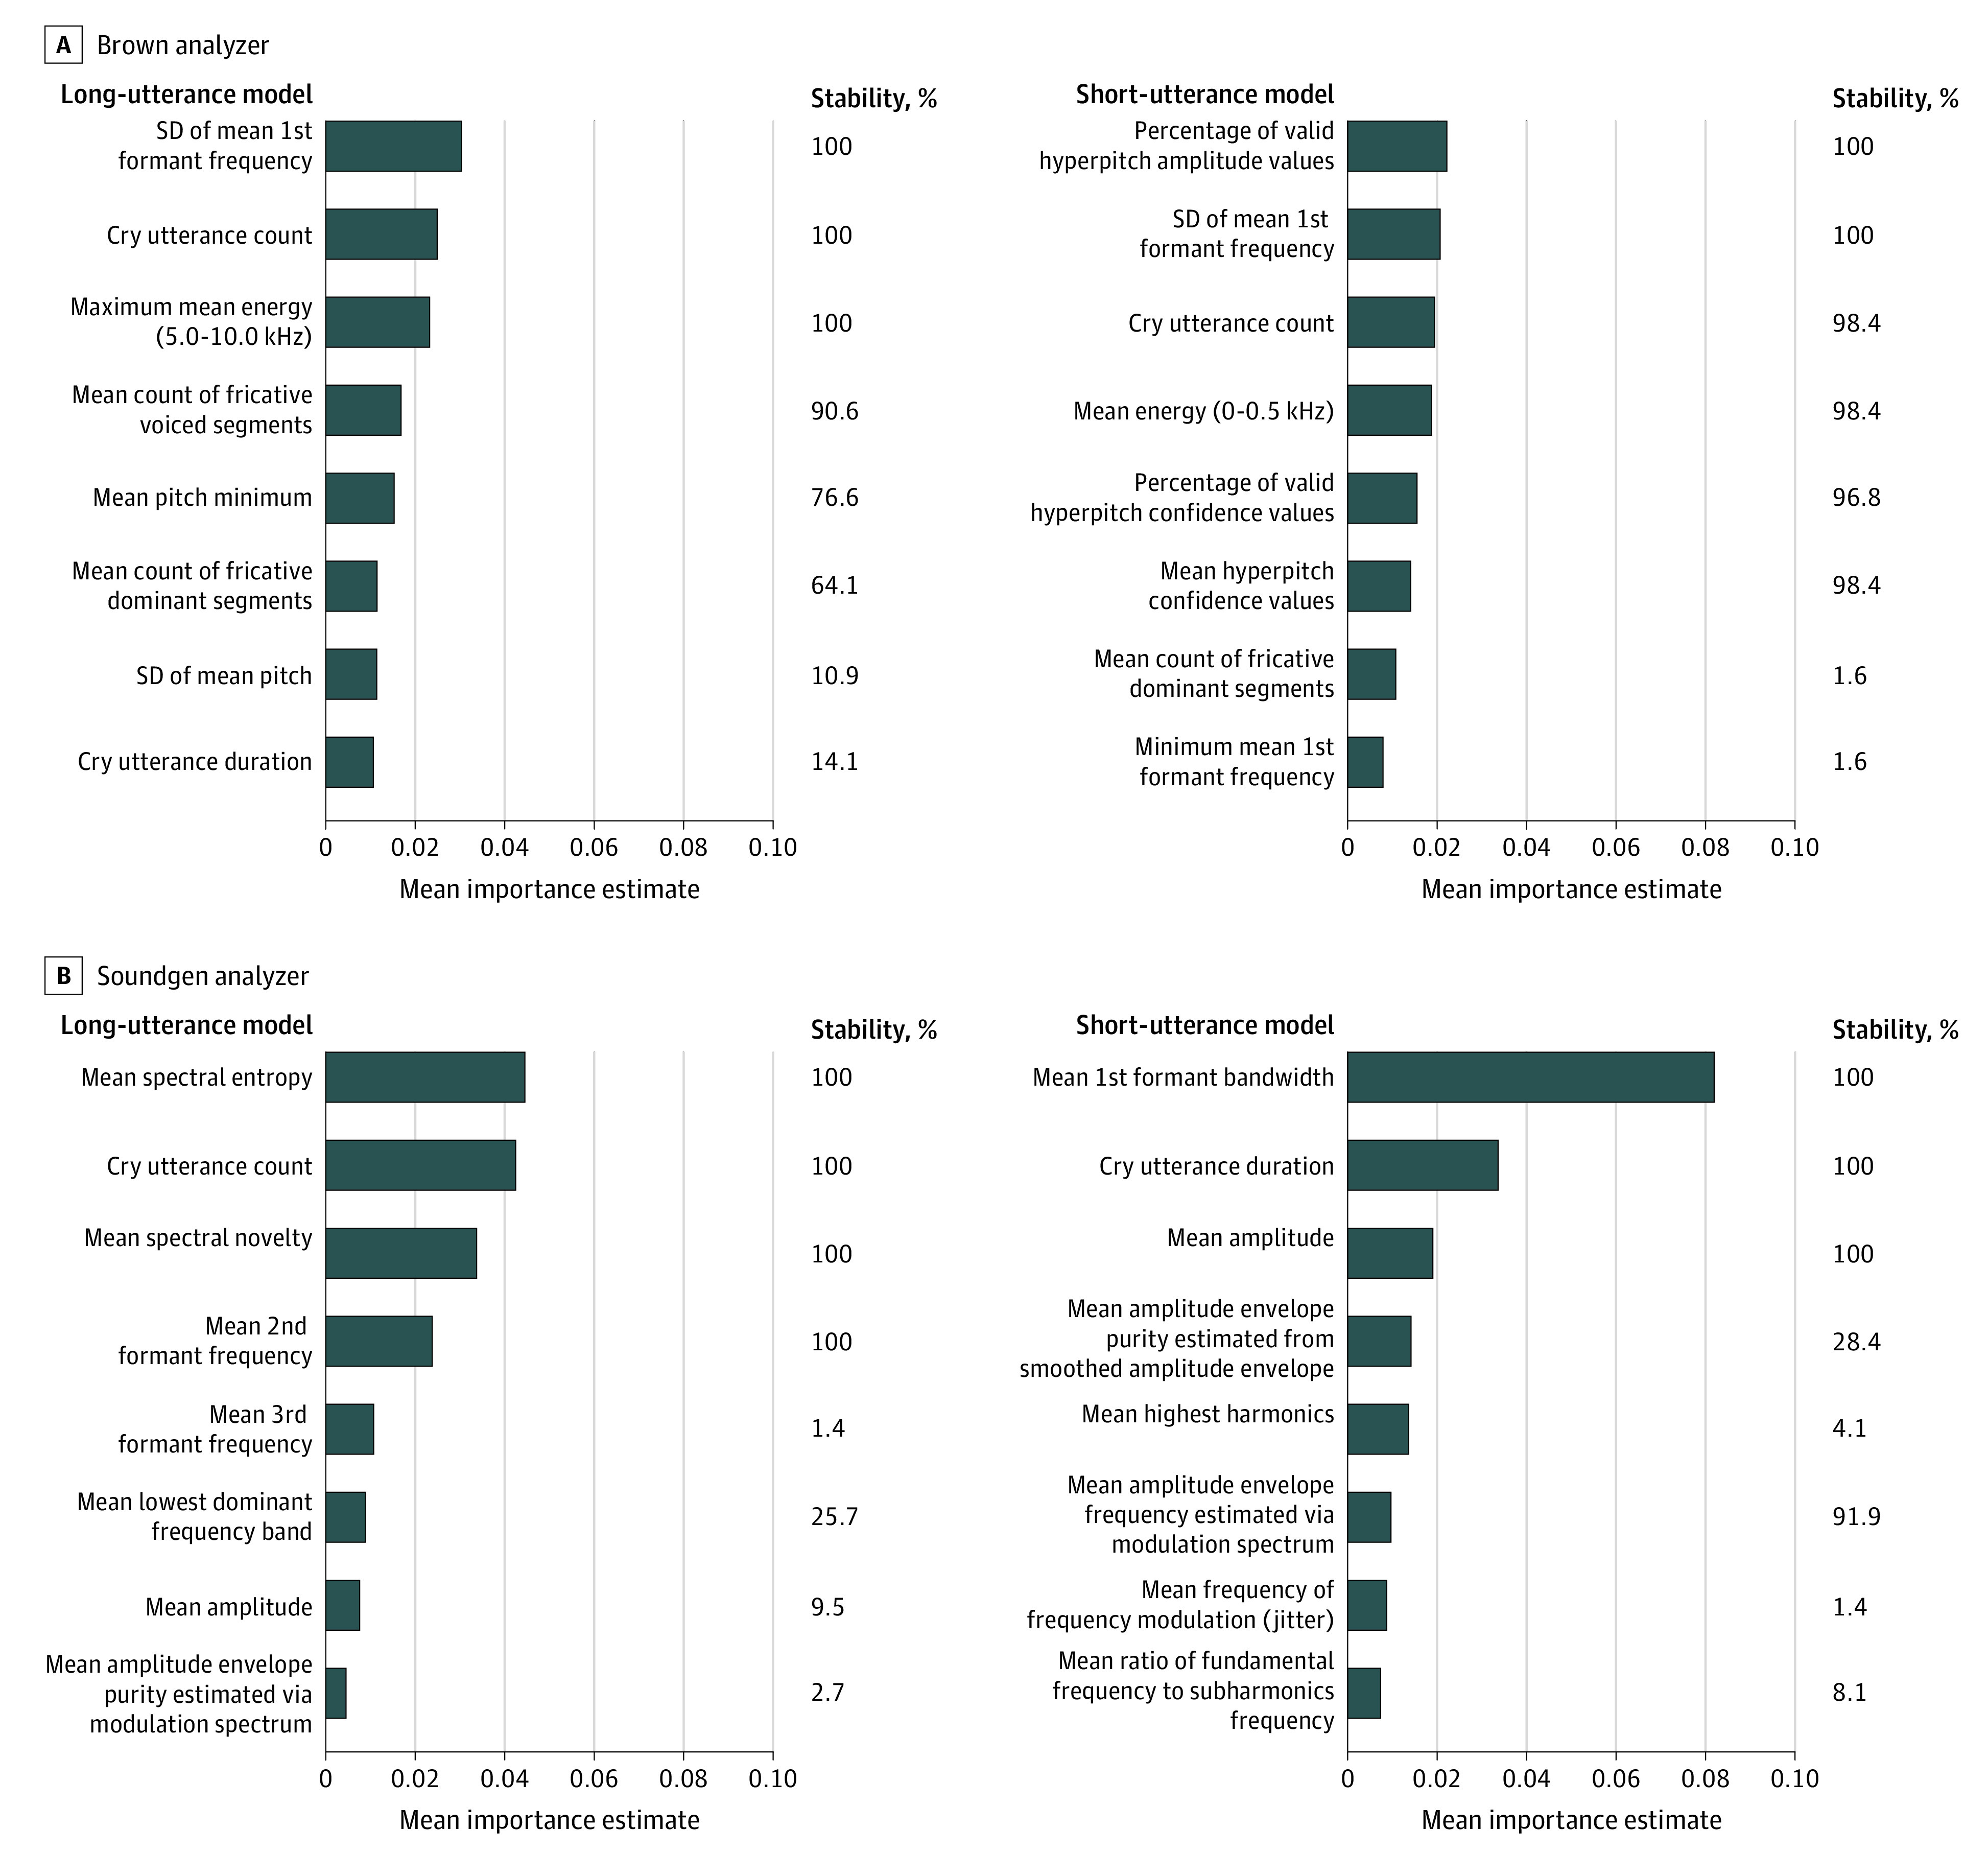
Figure 3. Acoustic Feature Importance and Stability Plots.

Mean importance estimates represent the relative contribution of a given variable to the final prediction across iterations of the cross-validation procedure. Variable stability was estimated by examining how frequently a given variable was retained for analysis during the feature selection step; for stability estimates, 100% indicates that a given variable was retained during all iterations of the cross-validation procedure. Both high importance and high stability are desirable.
