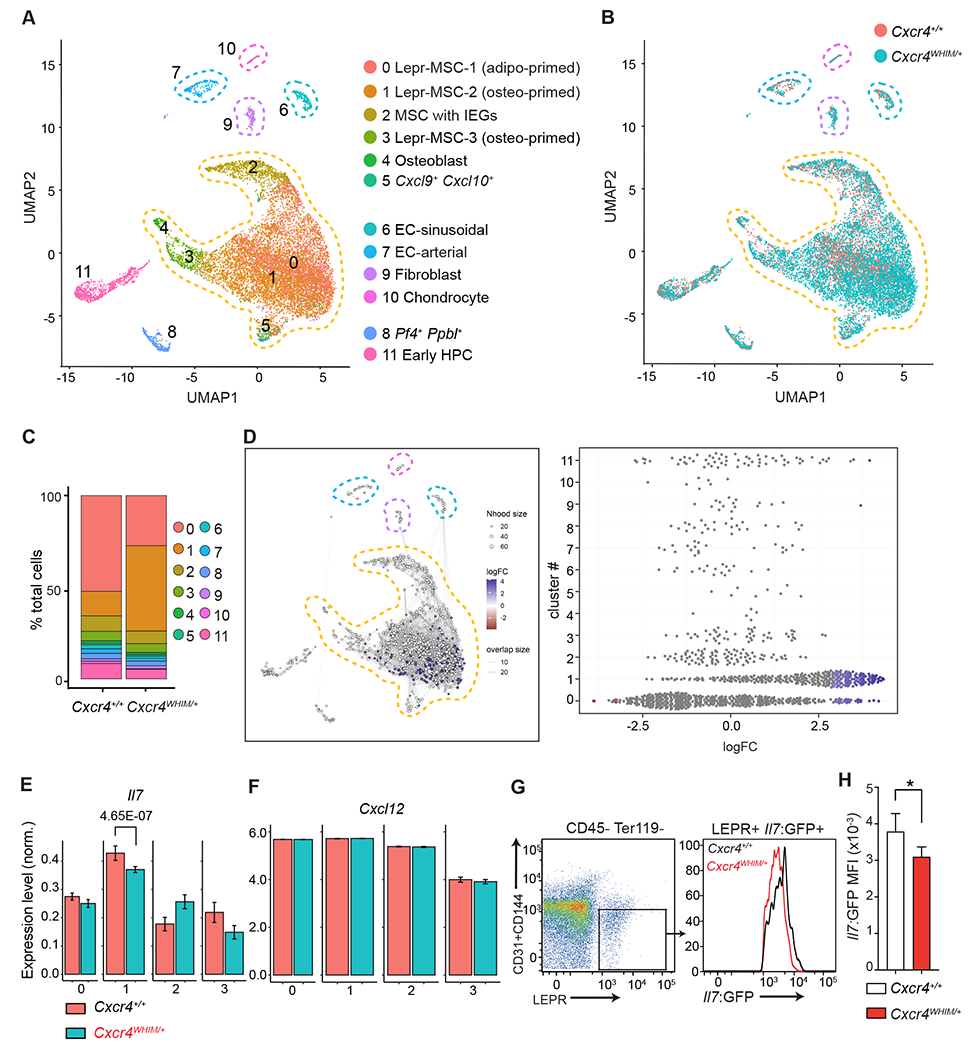
Figure 2: Transcriptional heterogeneity of BM non-hematopoietic stromal and endothelial cells of WHIM mice.

(A) UMAP visualization of scRNAseq data from BM endothelial and stromal cells.
Corresponding clusters are color coded, non-hematopoietic cell populations are marked with dashed lines. (B) Overlay of BM endothelial and stromal cell clusters as in (A) from Cxcr4+/+ and Cxcr4WHIM/+ mice. (C) Cluster representation in Cxcr4+/+ and Cxcr4WHIM/+ samples (D) Differential abundance test with Milo. Graphical representation (left). Beeswarm plot of logFC distribution in neighborhoods of cells from different Seurat clusters (right). Nodes represent neighborhoods colored by logFC between Cxcr4+/+ and Cxcr4WHIM/+. Node size corresponds to number of cells in each neighborhood. Graph edges show the number of cells shared between adjacent neighborhoods. (E) Normalized expression of Il7 in MSC clusters 0-3 of Cxcr4+/+ and Cxcr4WHIM/+ mice. Adjusted p-value is shown. (F) Normalized expression of Cxcl12 in MSC clusters 0-3 of Cxcr4+/+ and Cxcr4WHIM/+mice. (G) Cytometric analysis of Il7 expression in CD45− Ter119− CD31− CD144− LEPR+ MSC of Cxcr4+/+ and Cxcr4WHIM/+ Il7GFP/+ mice. (H) Il7-GFP MFI in Cxcr4+/+ and Cxcr4WHIM/+ Il7GFP/+ MSC. Data in panels G and H are representative of 3 independent experiments with 4-5 mice in each group/experiment. Bars indicate mean, error bars show standard deviation. * p ≤ 0.05, ** p ≤ 0.01, *** p ≤ 0.001 by unpaired two-sided Student’s t-test.
