
Figure 3: LTβR signaling in MSCs and control of Il7 expression.
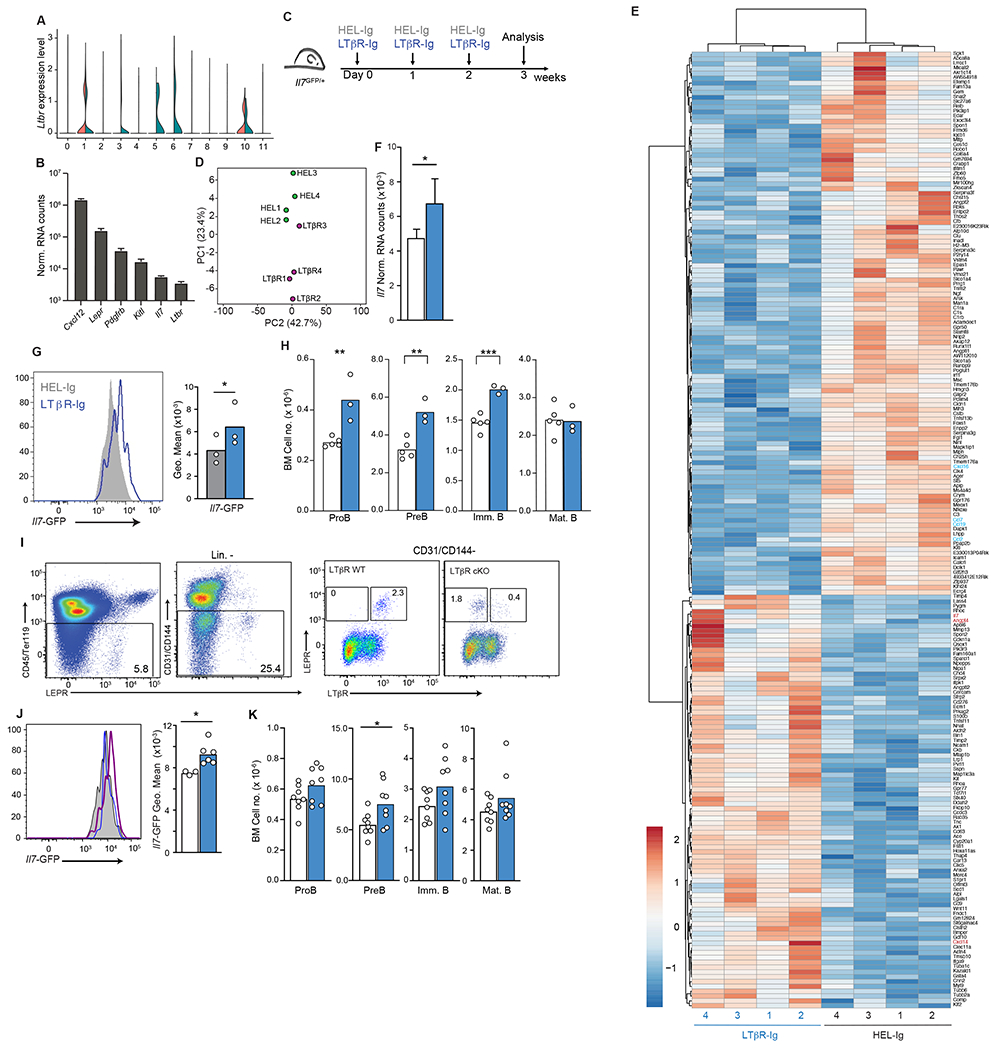
(A) Expression of Ltbr in BM endothelial and stromal cells of Cxcr4+/+ and Cxcr4WHIM/+ mice as violin plots. Data from clusters 0-11 of scRNAseq analysis as shown in Figure 1. (B) Normalized mRNA counts of Ltbr and key niche genes in sorted MSC measured by bulk RNA sequencing. (C) Experimental setup for LTβR signaling inhibition in Il7GFP/+ mice for 3 weeks. (D) PCA distribution plot (E) Differentially expressed genes (LogFC < 0.5 and adjust p< 0.05) between MSC from LTβR-Ig treated mice and HEL-Ig treated C57BL6/J mice. (F) Normalized Il7 expression in MSC from LTβR-Ig treated mice (blue, n=4) and HEL-Ig treated controls (white, n=4). (G) Histogram of Il7-GFP in MSCs of Il7GFP/+ mice treated with LTβR-Ig (blue) or HEL-Ig (grey). (H) Cell numbers of B cell developmental stages in the BM of LTβR-Ig treated (blue) and HEL-Ig treated (grey) WT mice. (I) Cytometric analysis of surface LTβR in MSCs of Lepr+/+ Ltbrfl/fl (LTβR WT) and LeprCre/+ Ltbrfl/fl mice (LTβR cKO). (J) Histogram of Il7-GFP in MSC of LTβR cKO and LTβR WT Il7GFP/+ mice. Histograms (left), grey: LTβR WT, blue: LTβR cKO, LTβR+ MSC, purple: LTβR cKO, LTβR− MSC. Bar graph (right), white: LTβR WT MSC, blue: LTβR cKO, LTβR− MSC. (K) Cell numbers of B cell developmental stages in the BM of LTβR WT (white) and LTβR cKO (blue) mice. Data in panels G-K are representative of 3 independent experiments. Bars indicate mean, circles depict individual mice. * p ≤ 0.05; ** p≤ 0.005; *** p≤ 0.0005 by unpaired two-sided Student’s t-test.