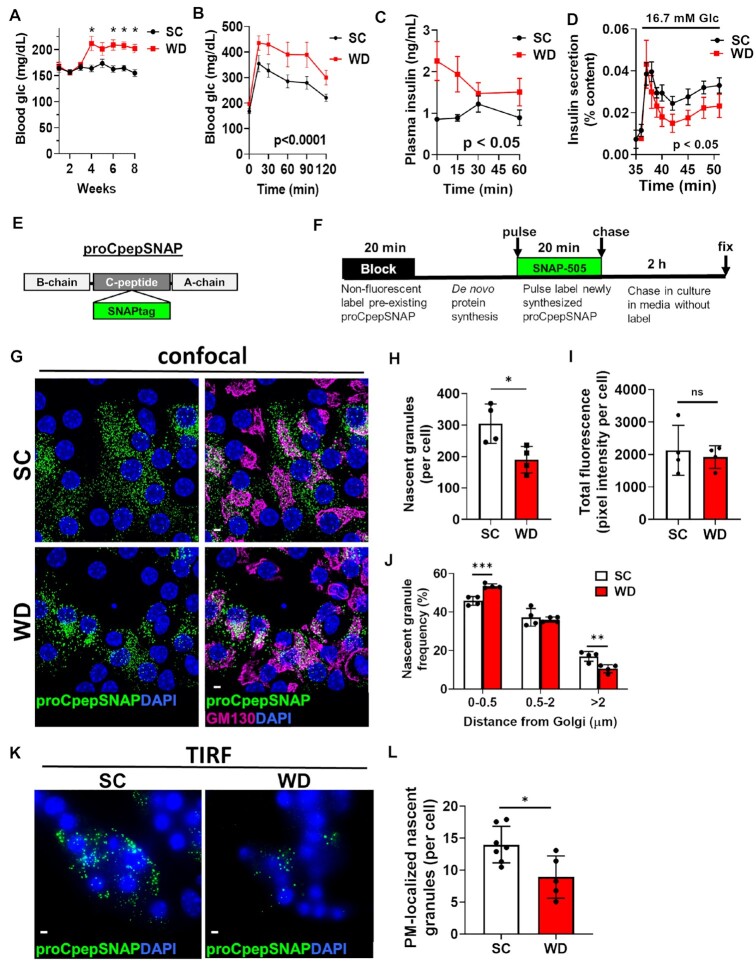
Figure 1.
Insulin granule formation is impaired in a rodent model of islet dysfunction. 8–10 wks old male C57BL6/J mice (n = 5–9 per group) were placed on a standard chow (SC) or Western diet (WD). Ad lib fed blood glucose (A) were recorded weekly. After 8 wks of diet, 4 h fasted mice were injected i.p. with 1 mg/g body weight glucose and blood glucose monitored for 2 h as indicated (B) and plasma sampled for insulin (C). (D) β-cell function was examined in isolated mouse islets by perifusion. (E) Model of the proCpepSNAP reporter with SNAPtag inserted within the C-peptide region of human preproinsulin. (F) Schematic of proCpepSNAP pulse-chase labeling timeline. Islets from SC vs. WD C57BL6/J mice (8 wks, G–J; 14 wks, K–L) were treated with AdRIP-proCpepSNAP. 48 h post-infection, islets were pulse-labeled with SNAP-505 (green), chased for 2 h, immunostained for GM130 (magenta), and counterstained with DAPI (blue). Confocal images were collected (G), and the total number of proCpepSNAP-labeled nascent granules quantified (H) (n = 4 mice per group; 22–25 cells/mouse) and total SNAP fluorescence per cell quantified (I). (J) Frequency distribution of binned proCpepSNAP-labeled granule distances (microns) from the Golgi were quantified (n = 4 mice per group). (K–L) proCpepSNAP pulse-chase labeling of β-cells from C57BL6/J mice (14 wks, SC or WD) were imaged by TIRF microscopy (K) and the total number of plasma membrane (PM)-localized proCpepSNAP-labeled granules are quantified (L) (n = 5–7 animals per group; 26–57 cells/mouse). (G and K) Scale bar = 5 μm. (A–D, H–J, and L) Data represent the mean ± SD * P < 0.05, ** P < 0.01, *** P< 0.005, or not significant (ns) by two-way ANOVA with Sidak post-test analysis (A–D, and J) or Student’s t-test (H, I, and L).

