Figure 2.
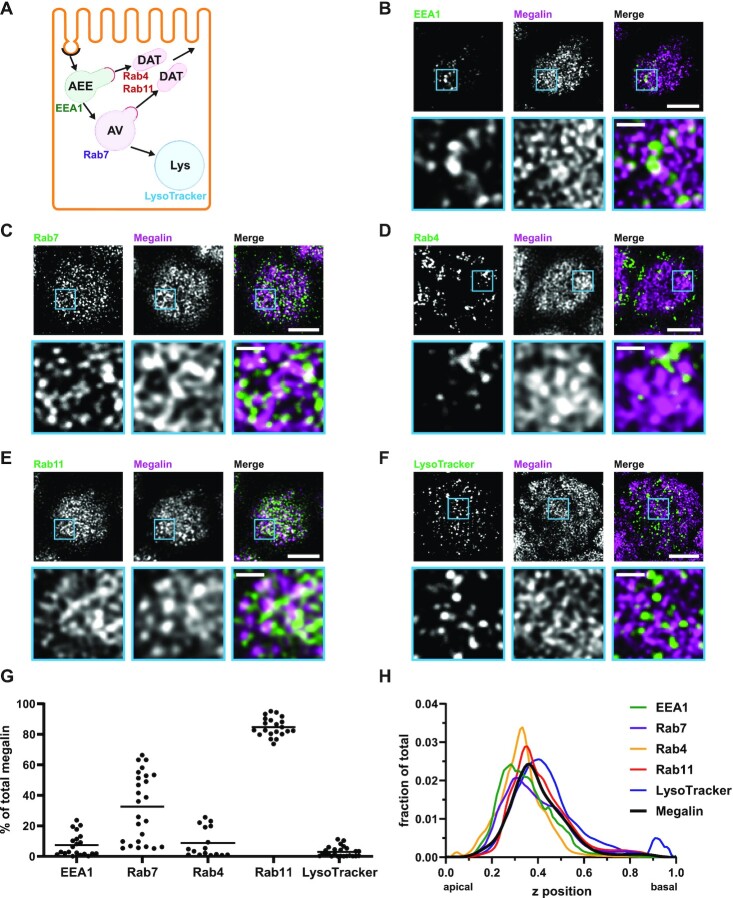
Steady-state distribution of intracellular megalin in OK cells. (A) Schematic of markers used to label endocytic compartments in PT cells: AEEs (EEA1), AVs (Rab7), DATs (Rab4 and Rab11a), and lysosomes (LysoTracker Red™). (B–F) OK cells on permeable supports were fixed and processed to detect megalin colocalization with the markers shown in panel A. Representative sum projection images of 6 planes were cropped to show a region of high colocalization of megalin with (B) EEA1, (C) Rab7, (D) Rab4, (E) Rab11a, and (F) LysoTracker Red within a single cell. Note the doming of the apical surface in these cells where subapical endocytic compartments are concentrated. Scale bars: 5 µm. Zoom-ins of selected areas are shown in blue boxes. Scale bars: 1 µm. (G) Megalin colocalization with each marker was quantified by Manders’ coefficient over the entire z-stack and plotted as the % of total megalin. Each point represents a single z-stack image. (H) The average fractional distributions of EEA1 (n = 111), Rab7 (n = 107), Rab4 (n = 61), Rab11a (n = 91), LysoTracker (n = 85), and megalin (n = 103) over the z-axis of a cell, from 0 (apical) to 1 (basal), are plotted. Individual curves with SEM for each marker are shown in Figure S2.

