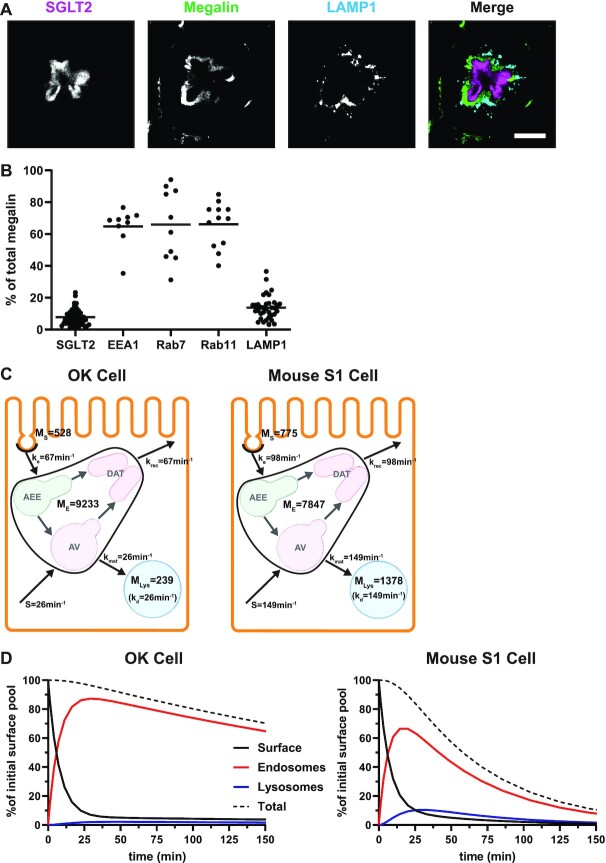
Figure 6.
Model of megalin traffic in S1 segment of mouse PT. Cortical kidney sections from 24 wk old female 129/Sv mouse were stained to label SGLT2, megalin, and LAMP1. (A) Representative sum projection images (20 planes) of megalin colocalization with SGLT2 and LAMP1 in an end-on tubule are shown. Scale bar: 10 µm. The weak staining on the basal aspect of the tubule in the megalin channel is due to background binding of the secondary antibody (see Figure S6F). (B) Colocalization of megalin with SGLT2 (n = 46, from 5 mice), EEA1 (n = 9, from 1 mouse), Rab7 (n = 10, from 1 mouse), Rab11a (n = 12, from 1 mouse), and LAMP1 (n = 35, from 5 mice), quantified by Manders’ coefficient over the entire z-stack, is plotted as a % of total megalin. Each point represents a single end-on tubule. (C) A graphical representation of the abridged model of megalin traffic comparing OK cells and S1 segment of mouse PT. Megalin is divided into a surface pool ( ), an intracellular pool within endosomes (
 ) that comprises AEEs, AVs, and DATs, and a lysosomal pool (
 ). Values within the pools denote the steady-state distribution of 10,000 molecules of megalin. Kinetic rate values are the number of molecules trafficked through that route per minute. (D) The predicted trajectory of the surface pool of megalin at time 0 min through each pool in the abridged model is simulated, with the synthesis rate set to zero as in Figure 4D. The endosome pool includes AEEs, AVs, and DATs as shown in panel C. The total megalin remaining from the initial surface pool is plotted with black dashed line.

