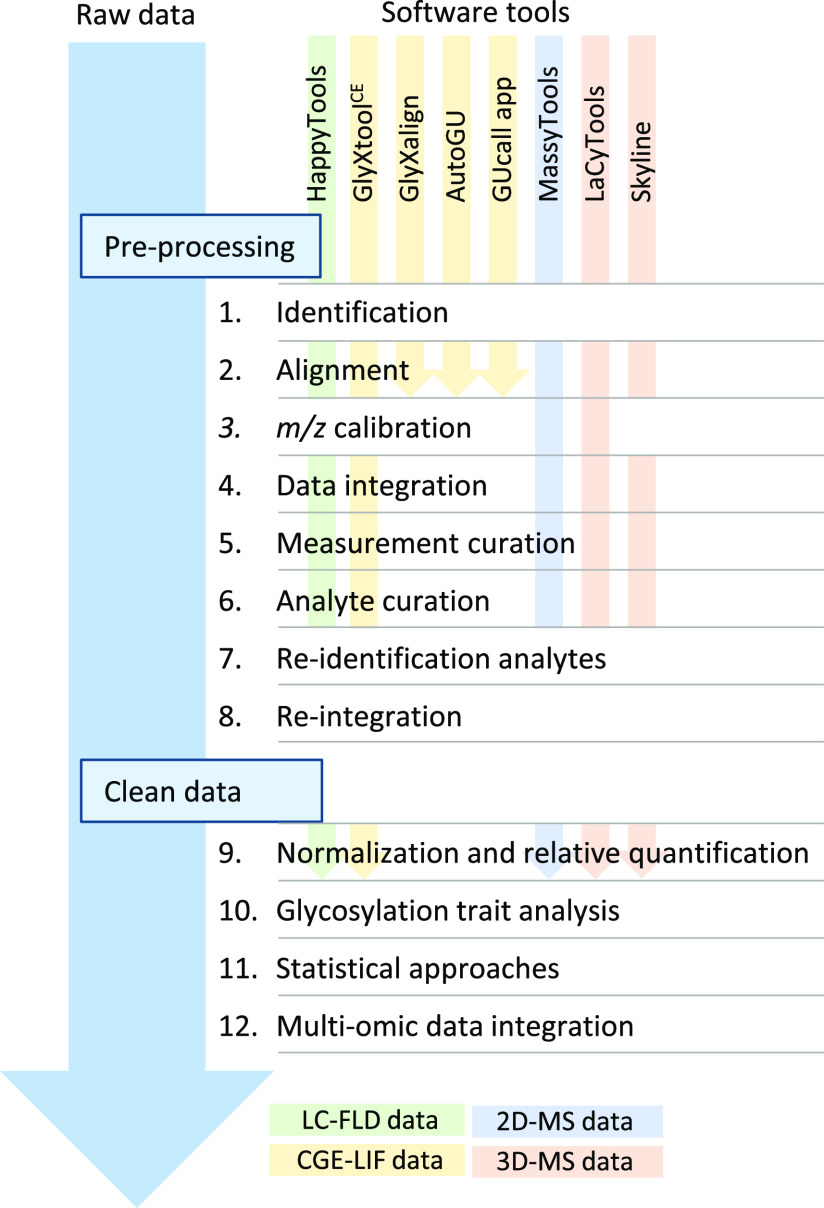
Figure 13.
Workflow for data (pre)processing and analysis. The various steps (1–8) involve preprocessing of raw data into clean data. Eventually, the data is normalized, and each analyte will be relatively quantified based upon the total summed area of all analytes observed in a measurement (%area), also known as direct glycosylation traits. To obtain insights in the biosynthetic pathway specific glycosylation features can be summed (e.g., galactosylation, sialylation, fucosylation). Either the direct or derived glycosylation traits can be used for statistical evaluation and the whole data set can be integrated with other data sets (e.g., proteomics or genomics).

