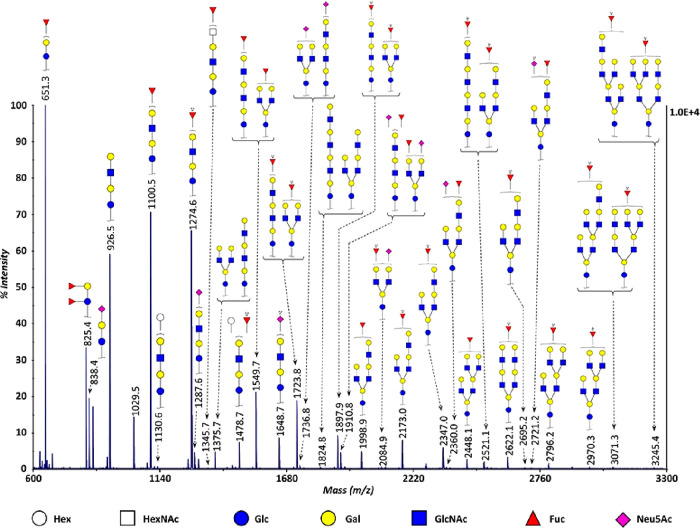
Figure 15.
Representative MALDI-TOF-MS spectrum of permethylated HMOs. All masses correspond to fully permethylated, free reducing end, sodium adducts of HMOs. Possible structures for each mass are shown. Free lactose was excluded from the spectrum. HMOs were identified using GlycoMod. Reproduced with permission from ref (16). Copyright 2020 Oxford University Press.

