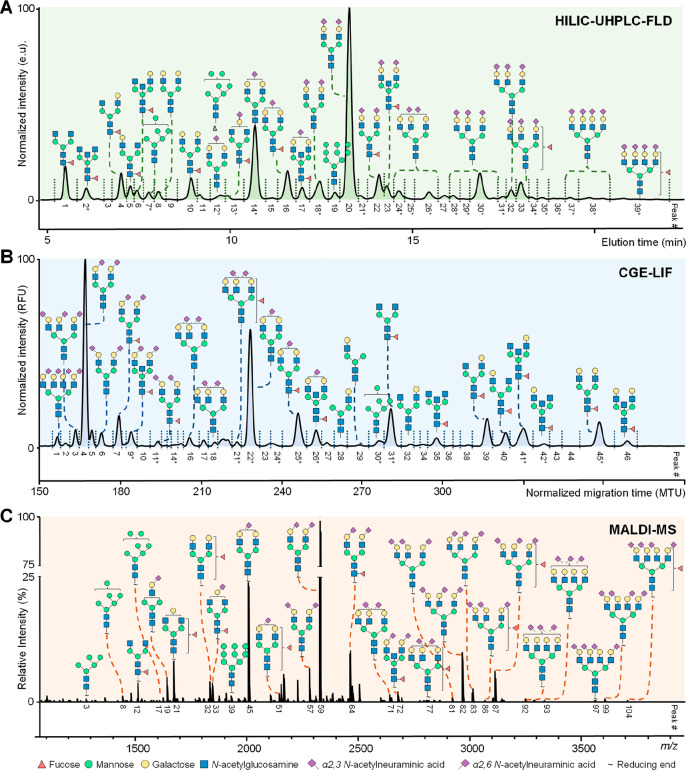
Figure 6.
Exemplary profiles of the total serum N-glycome using (A) HILIC-UHPLC-FLD, (B) CGE-LIF, and (C) MALDI-MS. (A) Chromatogram after 2-AB labeling by HILIC-UHPLC-FLD. (B) Electropherogram after APTS labeling by CGE-LIF. (C) Mass spectrum after differential sialic acid esterification by MALDI-FT-ICR-MS. The assigned signals in the MS spectra correspond to [M + Na]+. Please note that HILIC-UHPLC-FLD and CGE-LIF provide (in some cases) isomer separation in regard to branching (galactose arm, bisection, and fucose position). Structures are assigned based on exoglycosidase treatment and/or tandem MS data as well as literature knowledge on biosynthetic pathway of N-glycans. *Some signals for the HILIC-UHPLC-FLD and CGE-LIF correspond to multiple N-glycan compositions for which the most abundant one is assigned in the figure.

