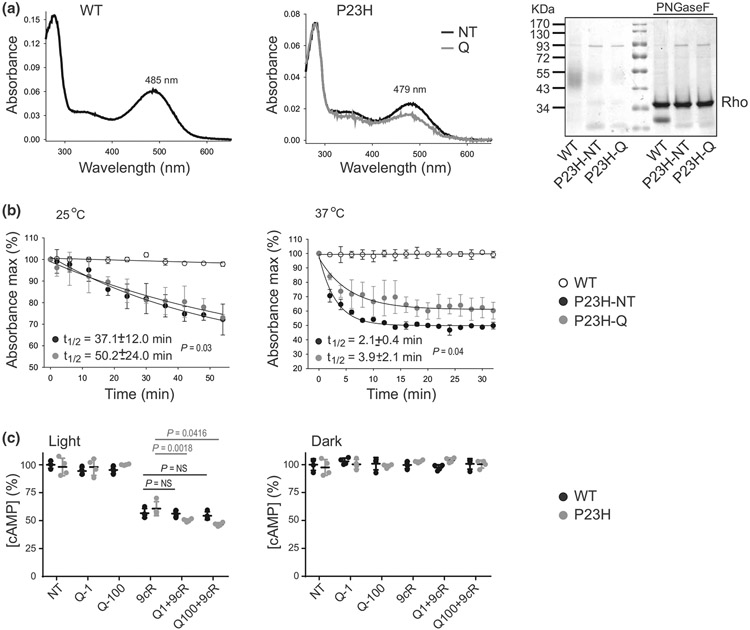
FIGURE 2.
The effect of flavonoids on P23H Rho stability and function. Rho was purified from the NIH-3T3 cells stably expressing wild type (WT) Rho or the P23H Rho mutant. (a) UV-visible absorption spectra of WT Rho (left panel) and P23H Rho immunopurified from either nontreated (black line, middle panel) or quercetin-treated cells (gray line, middle panel) and regenerated with 9-cis-retinal. The representative coomassie blue-stained SDS-PAGE gel of the purified Rho samples either nontreated or treated with PNGaseF deglycosylase (right panel) indicates that treatment with quercetin did not change the migration pattern of P23H Rho. (b) Thermal stability of P23H Rho either nontreated or treated with quercetin in comparison to WT Rho upon incubation at 25°C (left panel) and 37°C (right panel) (n = 3, F3,8 = 66.10, p < 0.0001). The UV-visible absorption spectra were recorded every 2 min in the dark. The percentage of remaining pigments normalized to their initial concentrations was then plotted as a function of time. The half-time (t1/2) of chromophore release was calculated from these plots. Each measurement was performed in triplicate. The experiment was repeated twice. Error bars represent standard deviation (S.D.). (c) The effect of quercetin on the cAMP levels in the NIH-3T3 cells expressing P23H Rho either nontreated or treated with quercetin and exposed to light (n = 3, F5,36 = 235, p < 0.0001). Cells expressing WT Rho were used as a control. Cells were incubated with quercetin for 16 hr and 9-cis-retinal for 2 hr before the measurement. Forskolin was added to the cells to saturate their cAMP levels followed by light illumination. Control cells, nontreated, treated with quercetin, or treated with 9-cis-retinal underwent the same procedure. These measurements were also performed in the dark (n = 3, F5,36 = 0.52, p = 0.76). cAMP levels were detected as described in Section 2. Each condition was performed in triplicate, and the experiment was repeated twice. Statistical analysis was performed with the one-way ANOVA and Bonferroni post hoc tests. The P-values for statistically different changes are indicated in the figure. NT, nontreated; 9cR, treated with 5 μM 9-cis-retinal; Q-1, treated with 1-μM quercetin; Q-100, treated with 100-μM quercetin

