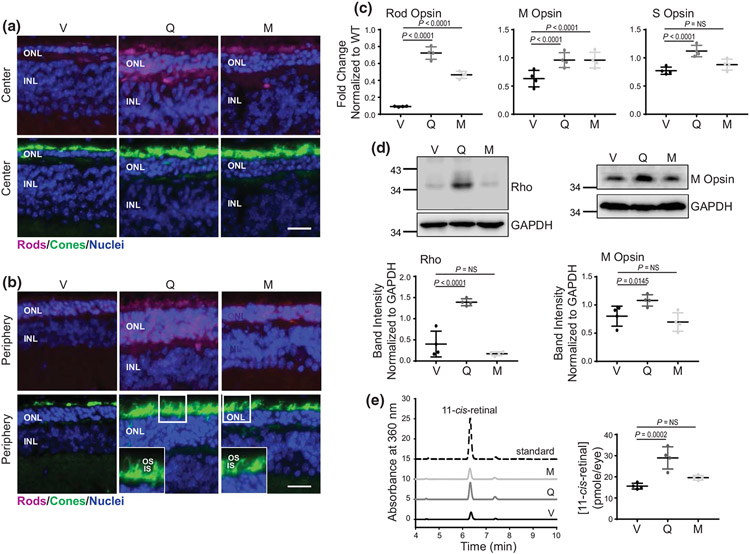
FIGURE 4.
The effect of flavonoids on the expression of Rho and cone opsins in RhoP23H/P23H mice. (a, b) Immunohistochemistry in cryosections prepared from eyes collected from RhoP23H/P23H mice at P21 treated with either vehicle or flavonoids. Sections stained with an anti-Rho C terminus-specific antibody (magenta) indicate the expression level of Rho and the structural organization of rod photoreceptors. Peanut agglutinin (PNA) staining (green) shows the expression of cone opsins and the structural organization of cone photoreceptors. 4′6′-diamidino-2-phenyl-indole (DAPI) stained the nuclei (blue). The center of the retina is shown in (a) and the retina periphery in (b). Scale bar, 25 μm. (c) The expression levels of photoreceptor-specific genes encoding rod opsin, M cone opsin and S cone opsin were examined by RT-qPCR; three runs were performed. Rod opsin (n = 3, F2,9 = 168.20, p < 0.0001), M cone opsin (n = 3, F2,9 = 7.44, p = 0.0124), and S cone opsin (n = 3, F2,9 = 16.00, p = 0.0011). Total RNA was isolated from the eyes of RhoP23H/P23H mice treated with either vehicle or flavonoids. Relative fold change of these genes' expression was normalized to the expression of Gapdh. Error bars indicate standard deviation (S.D.). The changes in the expression of the genes encoding rod opsin and M cone opsin were significantly different upon treatment with both flavonoids as compared with vehicle-treated control mice. The expression of S cone opsin was significantly upregulated only upon treatment with quercetin but not myricetin. The P-values for the statistically significant changes are indicated in the figure. The nonstatistically different changes are indicated as NS. Statistical analysis was performed for each gene separately, using one-way ANOVA analysis and Bonferroni post hoc tests. (d) Immunoblot analysis examining the changes in the protein expression of Rho (n = 3, F2,9 = 49.41, p < 0.0001) and M cone opsin (n = 3, F2,9 = 6.90, p = 0.0152), in the eyes of RhoP23H/P23H mice treated with either vehicle or flavonoids. Eyes from two mice from each treatment group were pooled to prepare protein extract. The representative immunoblots (upper panels) and quantification of Rho and M cone opsin protein expression levels (lower panel) are shown. Protein bands were quantified by densitometry analysis with ImageJ software. Band intensities were normalized to the intensity of GAPDH. Error bars indicate S.D. The mean of data from three independent experiments is shown. The P-values for the statistically significant changes are indicated in the figure. The nonstatistically different changes are indicated as NS. Statistical analysis was performed for each protein separately using one-way ANOVA and Bonferroni post hoc tests. (e) High-performance liquid chromatography (HPLC) elution profile of retinoid oximes extracted from eyes collected from dark-adapted RhoP23H/P23H mice at P21 treated either with quercetin (dark gray line), myricetin (light gray line), or vehicle (black line) (left panel); three HPLC runs were performed (n = 3, F2,9 = 25.16, p = 0.0002). 11-cis-retinal oxime was used as a standard control (dashed black line). Quantification of the 11-cis-retinal oxime concentration per eye in each treatment group (right panel). The P-values for the statistically significant changes are indicated in the figure. The nonstatistically different changes are indicated as NS. Statistical analysis was performed using one-way ANOVA analysis and Bonferroni post hoc tests. V, treated with vehicle, Q, treated with quercetin, M, treated with myricetin

