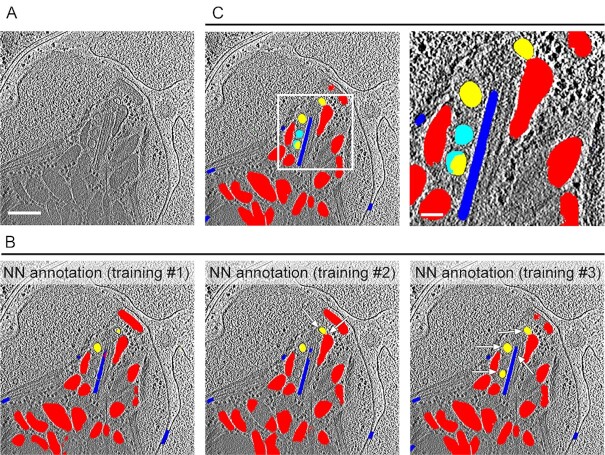
Fig. 3.
Annotation of distinct elements in the apical complex of Toxoplasma tachyzoites using a MSD neural network. (A) A representative slice from a tomogram that was not used in the training data and that is shown annotated in (B and C). Scale bar, 200 nm. (B) Annotation produced by the neural network after different iterative rounds of training (see results section for details) overlaid on the tomographic slice from (A) showing the AVs (yellow), rhoptries and micronemes (red), and microtubules (blue). Note the small but marked improvement in the annotation accuracy of the AVs, rhoptry, and IMT with each additional training as pointed by the arrows. (C) Manual correction (cyan) of the NN annotation after training #3. A zoomed-in view of the square in the left panel is shown in the right panel. Scale bar for the zoomed-in view, 50 nm.

