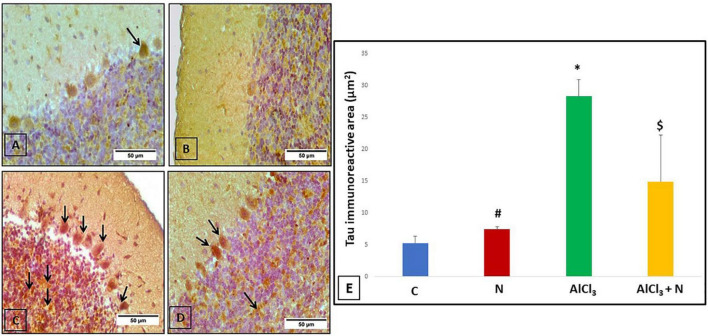
FIGURE 7.
Immunohistochemical detection of cerebellar tau protein: (A) The control rat showed weak positive tau immunoreaction in a Purkinje cell (arrow). (B) The rat showed negative tau immunoreaction. (C) AlCl3 group showed a strong positive tau immunoreaction in most Purkinje and granule cells (arrows). (D) The rat treated with combined AlCl3 and N showed weak positive tau immunoreaction in some Purkinje and granule cells (arrows) (Tau × 400). (E) Area% of tau-positive immune reaction in cerebellar sections of all studied groups. n = 6 in each group. Data were prescribed as mean ± SD. The intergroup variation was conducted by Games-Howell post-hoc test. *p < 0.001 compared with C group. #p < 0.001 compared with AlCl3. $p < 0.001 compared with AlCl3.

