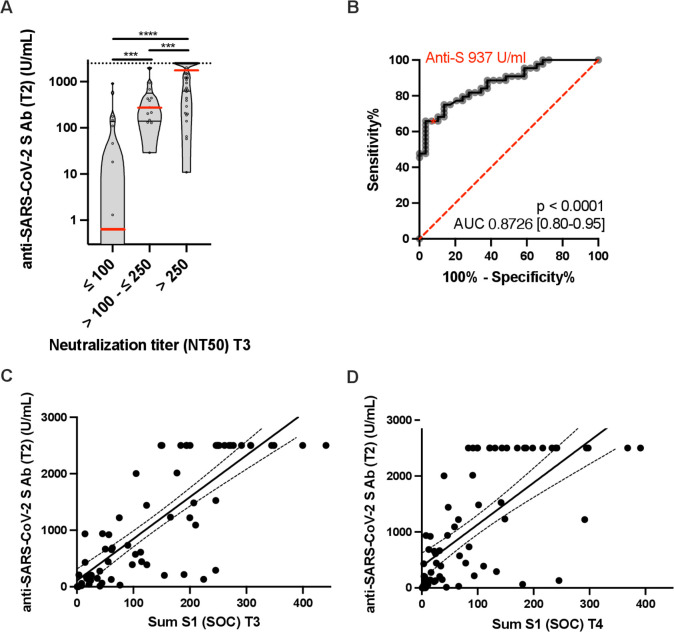
Figure 2.
Postvaccination anti-S IgG responses predict antiviral neutralization (NT50) at week 12. (A) The violins illustrate the kernel probability density. Red lines indicate the medians, black lines indicate 1st and 3rd IQR. Dots represent individual patients. ***p<0.001, ****p<0.0001. (B) ROC curve peak anti-S IgG at week 2 and NT50 at week 12. Performance of peak anti-S titers in discriminating RA patients with low neutralizing activity (NT50 > 250) at week 12. Anti-S 937 U/ml represents the decisive anti-S threshold value. ROC curve = receiver operating characteristic curves. Sensitivity 66%, specificity 97% (C) Spearman correlation (r = 0.78, p = p < 0.0001; Regression r2 = 0.6814, y = 7.391*x + 108.5, F = 151.8, p < 0.0001) between anti-S IgG at week 2 and sum S1 at week 12. (D) Spearman correlation (r = 0.67, p < 0.0001; Regression r2 = 0.4926, y = 7.477*x + 384.4, F = 68.94, p < 0.0001) between anti-S IgG at week 2 and sum S1 at week 24. T1=3 weeks after 1st vaccination, T2=2 weeks after 2nd vaccination, T3=12 weeks after 1st vaccination, T4= 24 weeks after 1st vaccination.

