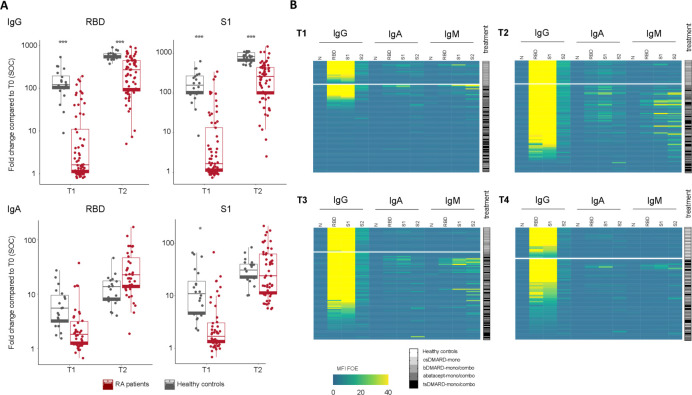
Figure 3.
Longitudinal vaccine-induced antibody responses by isotypes of vaccinated RA patients compared to healthy controls. (A) Comparison of IgA and IgG responses in RA patients capable of mounting an immune response after vaccination (n=64) and HC at visits T1 and T2. Levels of significance are calculated by unpaired t-test. *p<0.05, **p<0.01, ***p<0.001. (B) Heatmaps summarizing the measured MFI signals normalized to empty bead control (MFI FOE) that visualize IgG, IgA and IgM responses to RBD, S1, S2 and N on different DMARD regimen after the first (T1) and second vaccine dose (T2) and after 12 (T3) and 24 weeks (T4) for HC and RA patients. T1=3 weeks after 1st vaccination, T2=2 weeks after 2nd vaccination, T3=12 weeks after 1st vaccination, T4= 24 weeks after 1st vaccination *p<0.05, **p<0.01, ***p<0.001.

