Fig. 3.
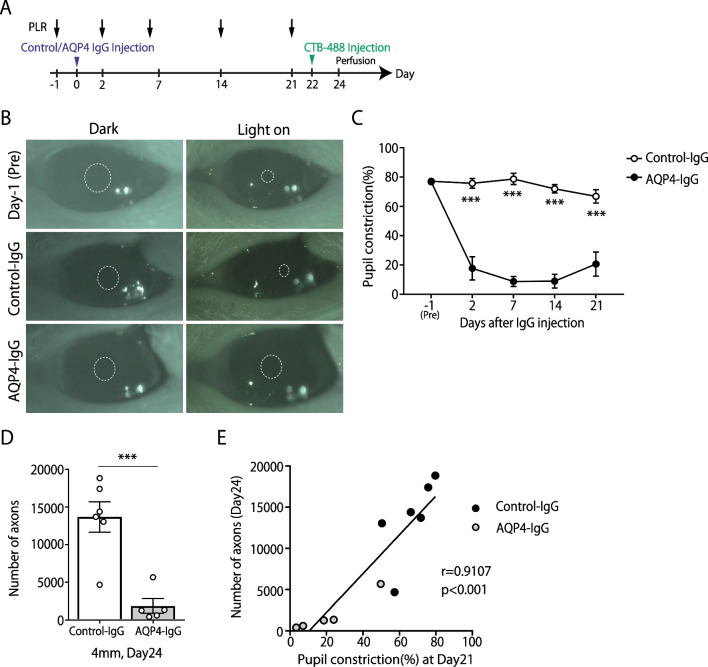
Aquaporin-4 (AQP4)–immunoglobulin G(IgG)-induced optic neuritis (ON) rats exhibit severe visual dysfunction. A Experimental time course. Pupillary light reflex (PLR) analysis was conducted on days −1, 2, 7, 14, and 21. B Representative images of the pupil recorded in the PLR experiment at before and 7 days after IgG injection. The dotted line indicates the edge of the pupil. C Quantification of the pupil constriction (%) (Control-IgG: n = 6, AQP4-IgG: n = 5, mean ± SEM, ***p < 0.001, assessed by two-way analysis of variance (ANOVA) followed by Bonferroni test). D Quantification of CTB-labeled axons at 4 mm posterior to the IgG-injected site (Control-IgG: n = 6, AQP4-IgG: n = 5, mean ± SEM, ***p < 0.001 assessed by Student’s t test). E Spearman's correlation coefficient test was used to assess the correlations between the number of CTB-positive axons (day 24) and constriction rate of Pupillary light reflex (day 21) (Control-IgG: n = 6, AQP4-IgG: n = 5)

