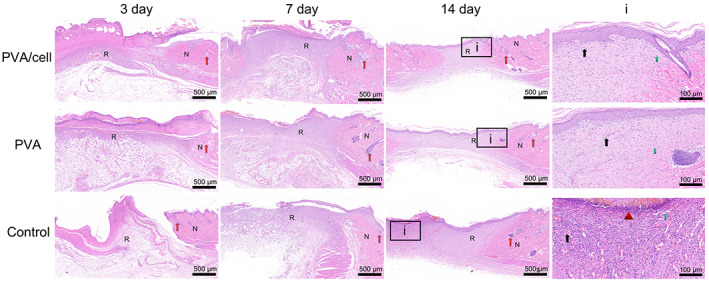
FIGURE 7.

H&E staining showing the wound healing and skin regeneration of the control group, PVA group and PVA/cell group on the 3rd, 7th and 14th days. (N represents normal tissue and R represents repaired tissue, i represents the magnification of day 14, the red arrow represents appendages, the black arrow represents capillary, the green arrow represents fibrocytes, the triangle represents inflammatory cells, scar bar = 500 μm, 100 μm)
