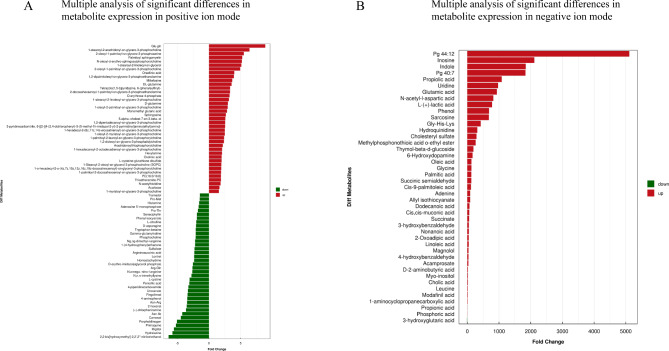
Fig. 8.
Metabonomics analysis of Ttc39c and its metabolites in LUAD. (A) Histogram of difference multiple analysis of metabolites expression with significant difference in positive ion mode. (B) Histogram of difference multiple analysis of metabolites expression with significant difference in negative ion mode. The abscissa indicates the differential expression multiple, red indicates that the differential expression multiple is greater than 1, and green indicates that the differential expression multiple is less than 1. The ordinate indicates metabolites with significant difference

