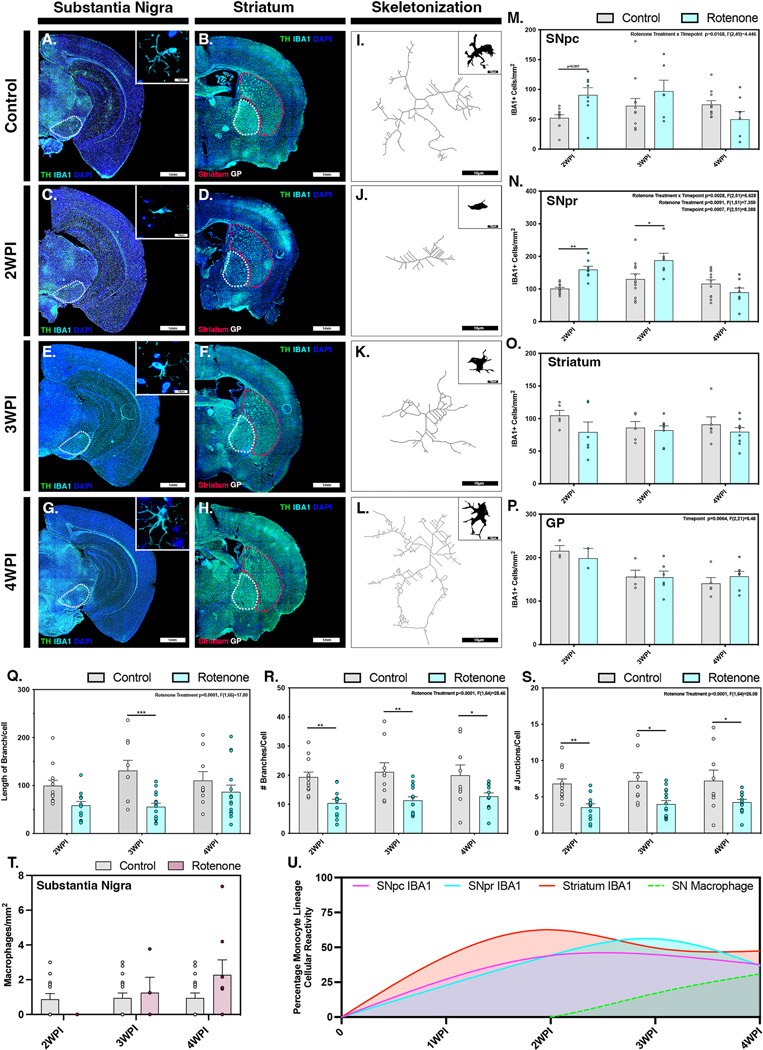
Figure 2. Systemic administration of rotenone causes temporally and regionally distinct patterns of microglia activation.
Microglial activation from an M2 phenotypic state to an active ameboid M1 phenotype was investigated in control (A,B) and rotenone-treated animals at 2 WPI (C,D), 3 WPI (E,F) and 4 WPI (G,H) within the substantia nigra and the ST, respectively (TH, green). Analysis of microglia phenotype by skeletonization and filament tracing was conducted in the SNpr in control (I), 2 WPI (J), 3 WPI (K) and 4 WPI (L) animals. Quantification of IBA1+ cells (cyan) associated with microgliosis/microcytosis was performed within the SNpc (M), SNpr (N), ST (O) and GP (P) at all timepoints. (Q-S) Changes in length of branches per cell (Q), number of branches per cell (R) and number of junctions per cell (S) was also quantified at each timepoint. (T) The number of invading monocytes was quantified in the substantia nigra. (U) Normalized counts of IBA1+ cells in the SNpc (pink), SNpr (cyan), ST (red) and invading macrophages within the SNpc (green dashed line) were modeled over the 4-week time course of the study. (N=4 mice/control group, N=7 mice/rotenone group) *p<0.05, **p<0.01, ***p<0.001

