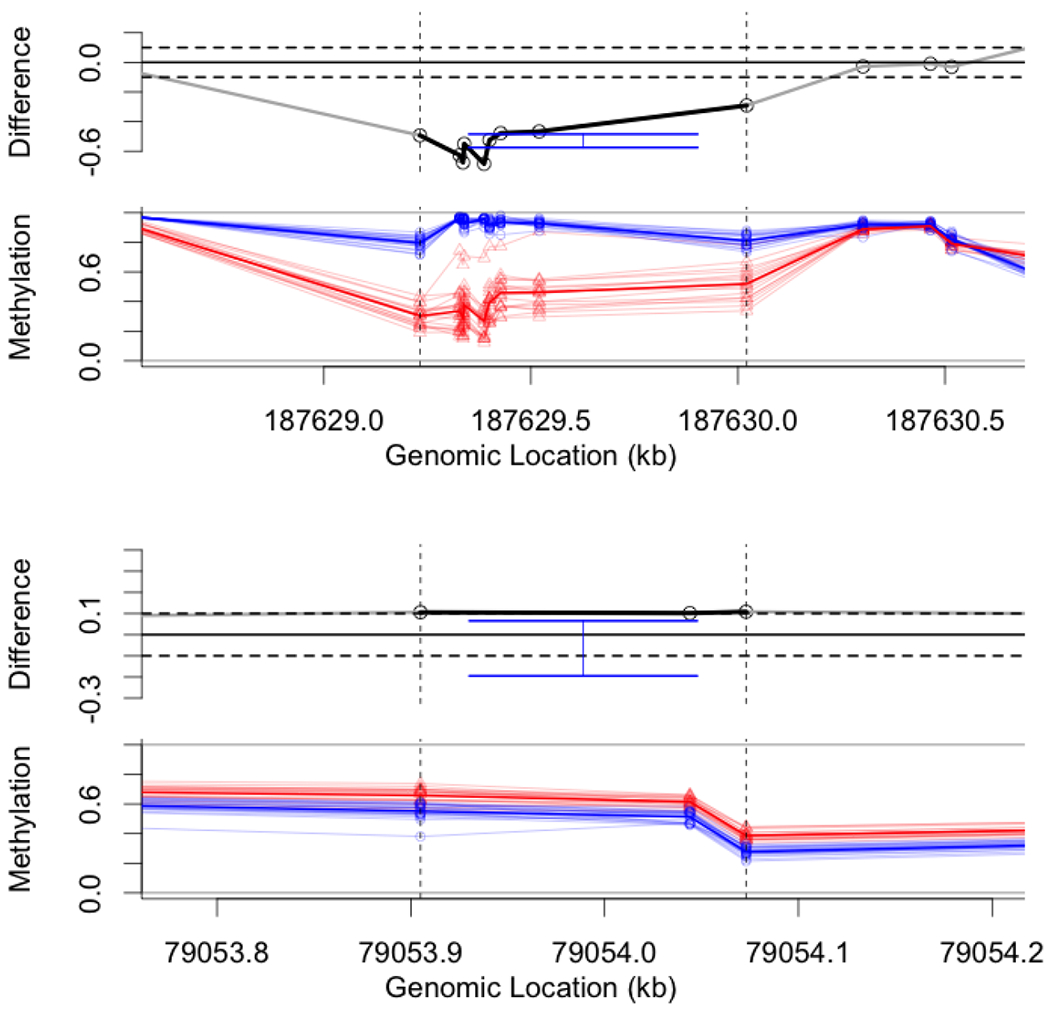
Figure 1: Intervals for differential methylation regions.

Confidence intervals for the mean between-tissue difference in two genomic regions. Top pair: the figures show a nine-site region in chromosome 4 (within the vertical dashed lines). The mean-difference (top) is considerably below the negative threshold. Individual samples are plotted below, colored by tissue type, and show relatively small within group variance. Hence, the estimated 90% confidence interval (blue, top) is relatively short and the estimate for the effect, , is close to the observed mean. Bottom pair: the figures show a three-site region in chromosome 17 which is just above the threshold. Although the observed average is , after correcting for selection the estimated confidence interval covers 0. Data was collected by The Cancer Genome Atlas consortium (TCGA).
