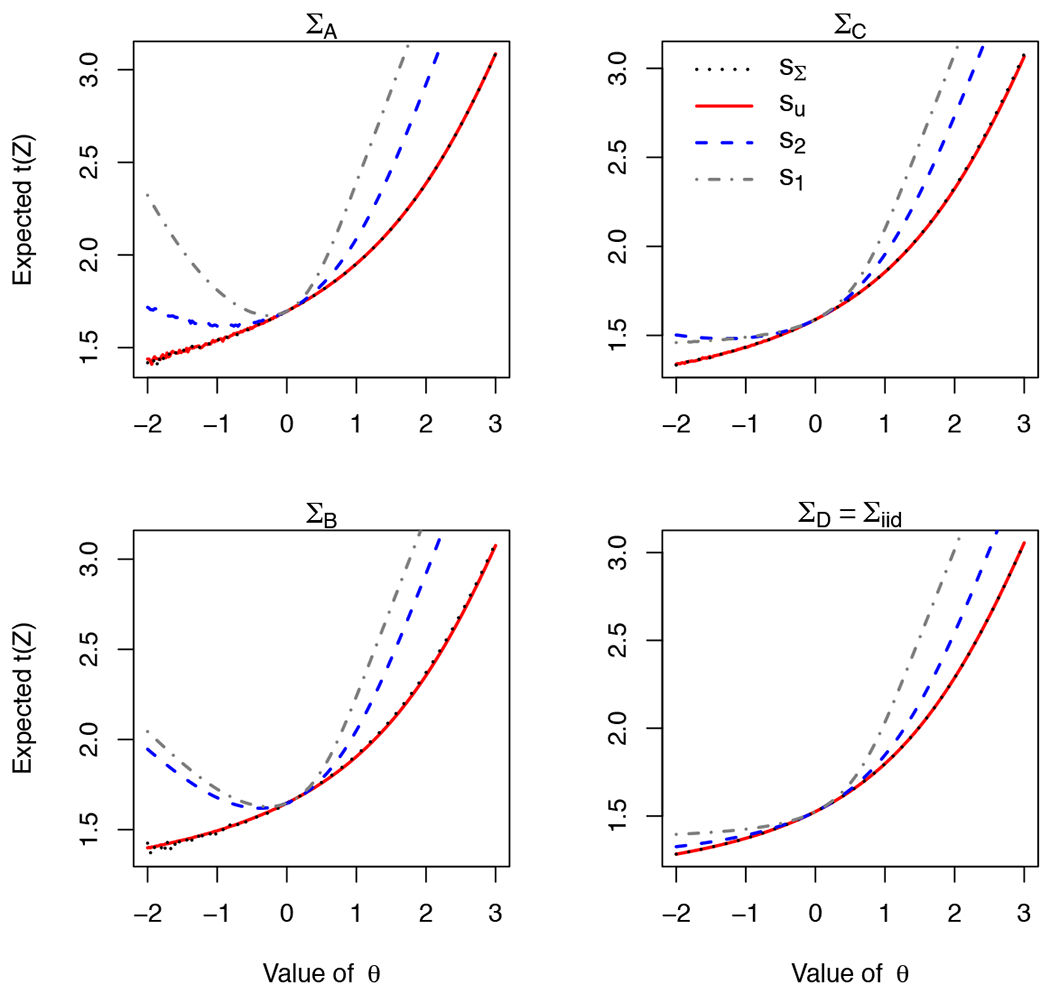
Figure 5: Comparison of profiles vectors and covariances.

Conditional mean of as a function of θ for different covariances (panels) and profiles (colors). Threshold is c = 1. In all panels, we use the following profiles: sΣ ∝ (1, 1, 1)′Σ in black, su = (1, 1, 1) in red, s2 = (1.5, 0, 1.5) in blue, and s1 = (3, 0, 0) in grey. In the top-left and bottom-right panels, su ≡ sΣ). All covariances have unit variance, and the number of correlated variables decrease from ΣA (ρ = 0.4 between every pair), through ΣB (as before but ρ13 = 0), ΣC (ρ12 = 0) and uncorrelated ΣD. We observe method is not very sensitive to small differences in the profile, as sΣ, su give almost identical curves for ΣB and ΣC. The figure shows that although sΣ ensures EΘs(θ)[t(Z)] strictly increases with θ (monotonicity, Lemma 2), monotonicity is not guaranteed for s2 or s1. For ΣC, s1 satisfies the conditions of Lemma 3 and displays monotonicity, whereas s2 does not. When the covariance is iid, any non-negative profile satisfies Lemma 3. Under all covariances, the curves for s1, s2 are greater than sΣ; this is a potential source for coverage error if sΣ is used.
