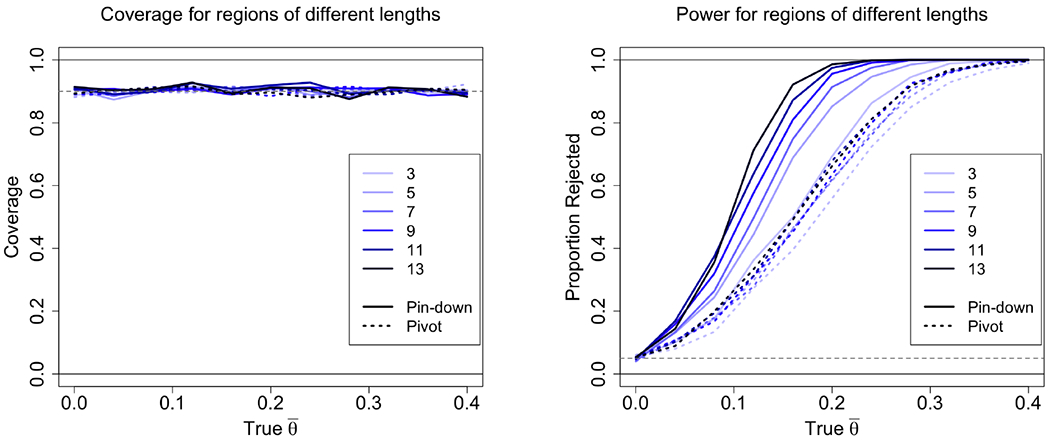
Figure 7: Increasing Regions (Experiment 3):

Coverage (left) and power (right) is plotted for regions of different lengths (line color) and true effect size (x-axis). The pin-down conditional interval (continuous line) is compared to the pivot-based conditional interval of Lee et al. (2016) (dotted line). Power increases with region size. The increase is much more pronounced in the pin down algorithm, whereas for the pivot there is little increase in coverage with growing region size. Coverage for both algorithms is similar to the nominal rate. Each point averages 1000 runs.
