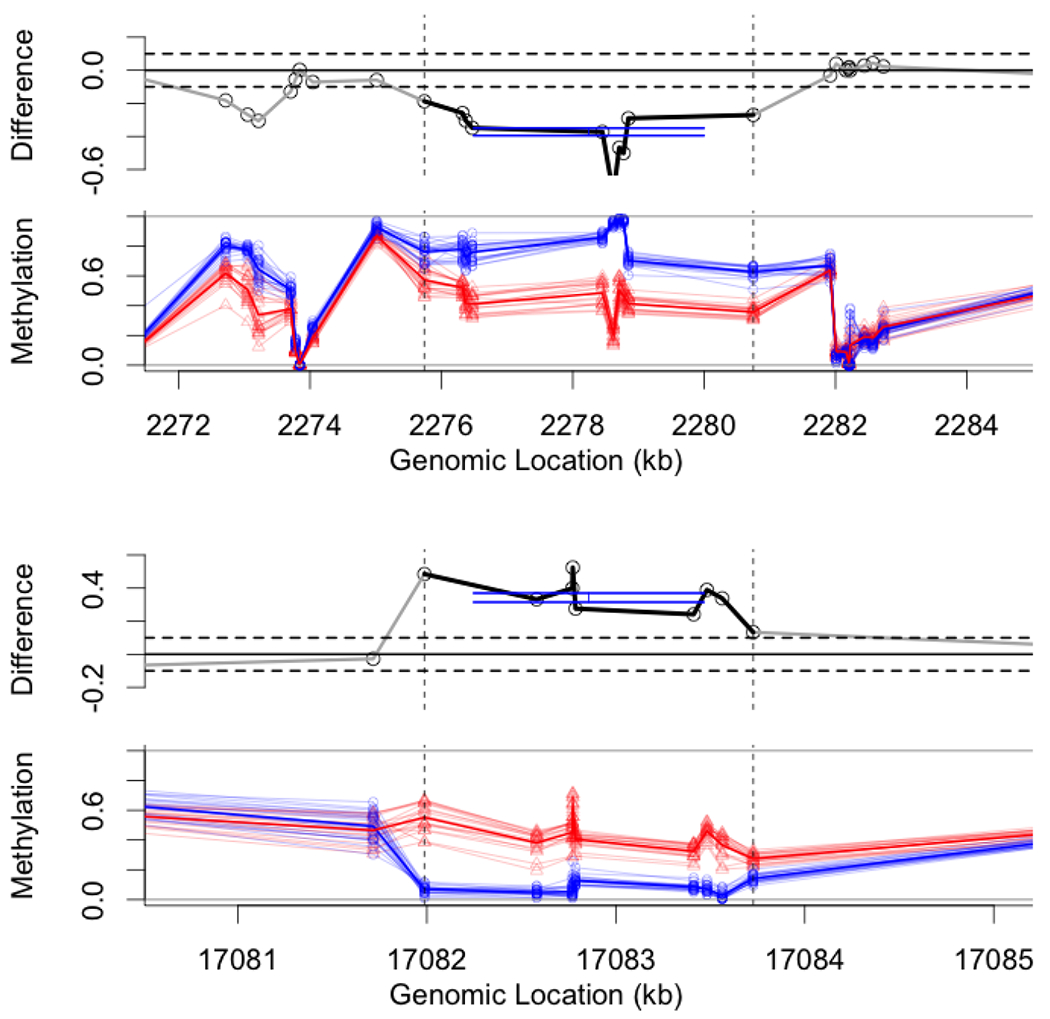
Figure 8: Examples undetected by non-parametrics.

Two example regions that are detected using our method, but not detected using the non-parametric FWE approach at α = 0.05 level. On left is a 10-site region from chromosome 19: we estimate with interval Î = [0.35, 0.4] and pBH < 10−10; non-parametric FWE was 0.06. On right is a 9-site region from chromosome 22: we estimate with interval Î = [0.32, 0.375] and pBH < 10−10; non-parametric FWE was 0.1. Data is from TCGA; see details in text.
