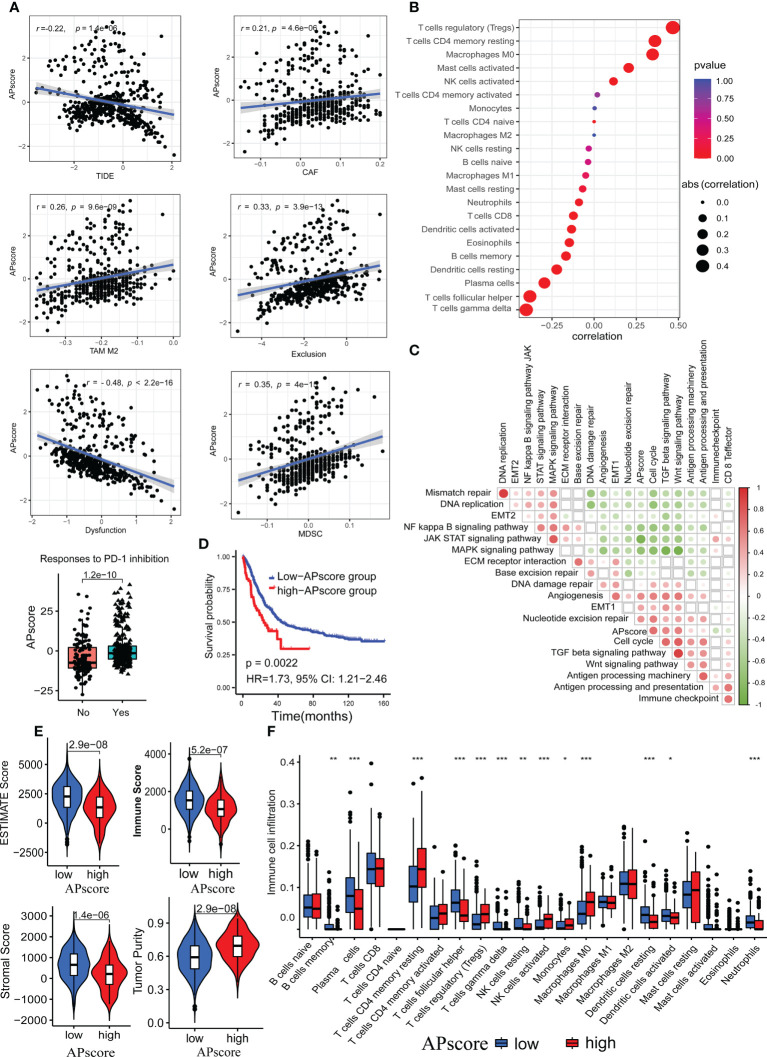
Figure 3.
The associations of the APscore with immunotherapy response, immune microenvironment, and survival in aGC patients. (A) The relationship of the APscore with indicators of immunotherapy response predicted by the TIDE algorithm. (B) The relationship of the APscore with infiltration of the 22 immune cells calculated by the CIBERSORT algorithm. (C) The interrelations of the APscore with PCA genes scores of important biological pathways of GC. The white squares represent no statistically significant. (D) Kaplan-Meier survival plots in both groups of 467 aGC patients. (E) Comparison of the tumor purity, estimate, immune, and stromal scores between the high-APscore and low APscore-groups. (F) Comparison of the 22 immune cells proportions between the high-APscore and low APscore-groups. Asterisks denote significant differences (*p< 0.05; **p< 0.01; ***p< 0.001).

